Warm-up
- What’s wrong with the following code
── Attaching core tidyverse packages ──────────────────────── tidyverse 2.0.0 ──
✔ dplyr     1.1.2     ✔ readr     2.1.4
✔ forcats   1.0.0     ✔ stringr   1.5.0
✔ ggplot2   3.4.3     ✔ tibble    3.2.1
✔ lubridate 1.9.2     ✔ tidyr     1.3.0
✔ purrr     1.0.2
── Conflicts ────────────────────────────────────────── tidyverse_conflicts() ──
✖ dplyr::filter() masks stats::filter()
✖ dplyr::lag()    masks stats::lag()
ℹ Use the conflicted package (<http://conflicted.r-lib.org/>) to force all conflicts to become errors
library(gapminder)
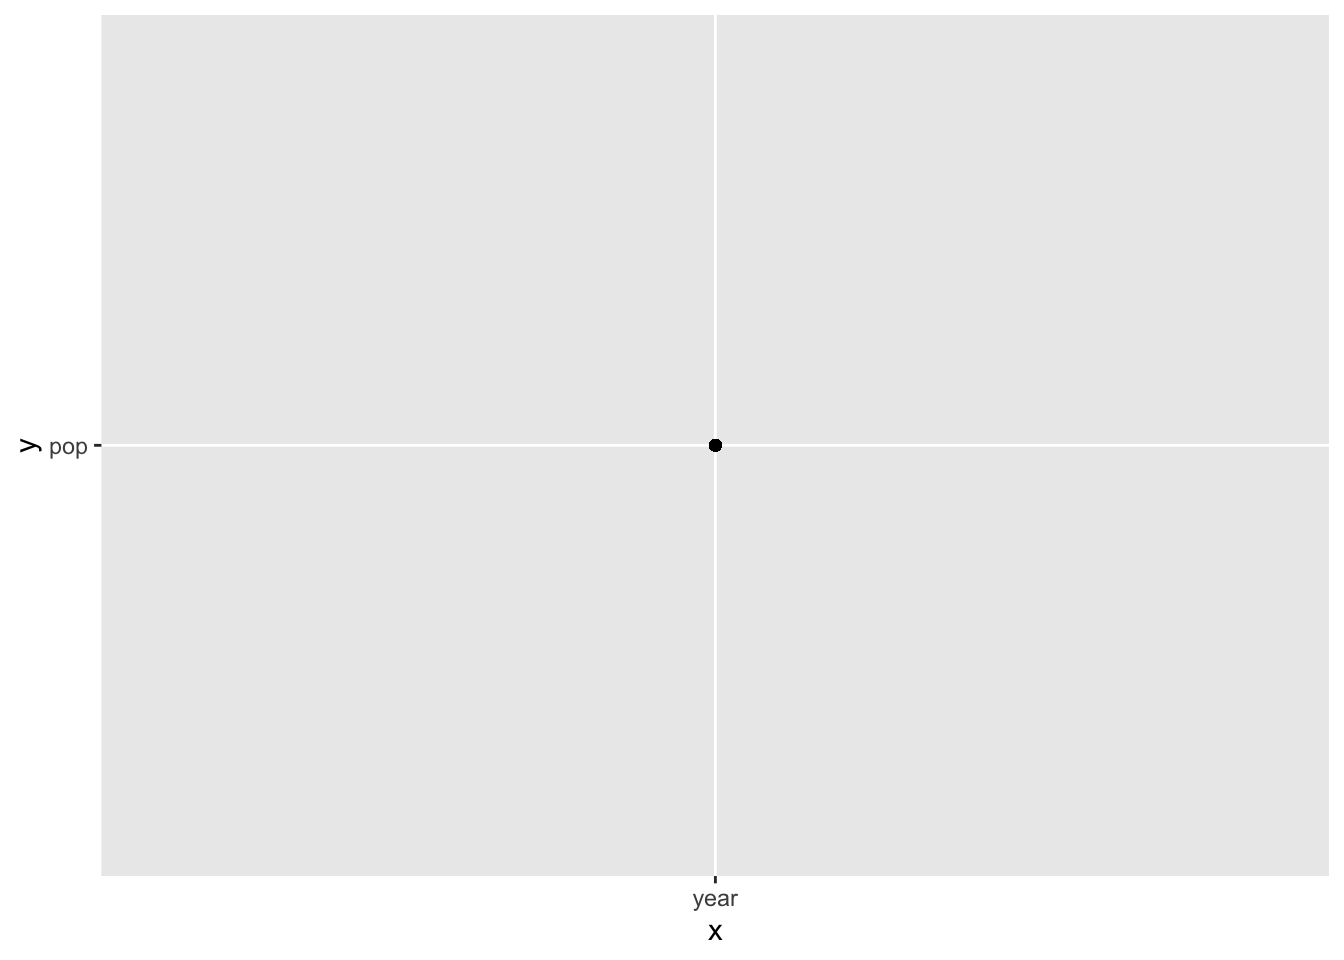
ggplot(gapminder,aes(x="year",y="pop")) + geom_point()
- Create an R-script that does the following.
- Load the gapminder data
- Create a variable where each value is a country in the gapminder data set, with no repeats.
- Use
%in% to see if the variable contains various countries of your choice.
- Learn how to execute the script using the keypad. Below is one way to execute a script.
source("my_script.R",echo = TRUE)
The filter command
Below we make a subset of the data, whose country is China
C <- filter(gapminder,
       country == "China")
Do a ?filter to learn how else to modify the 2nd parameter using & , | and more.
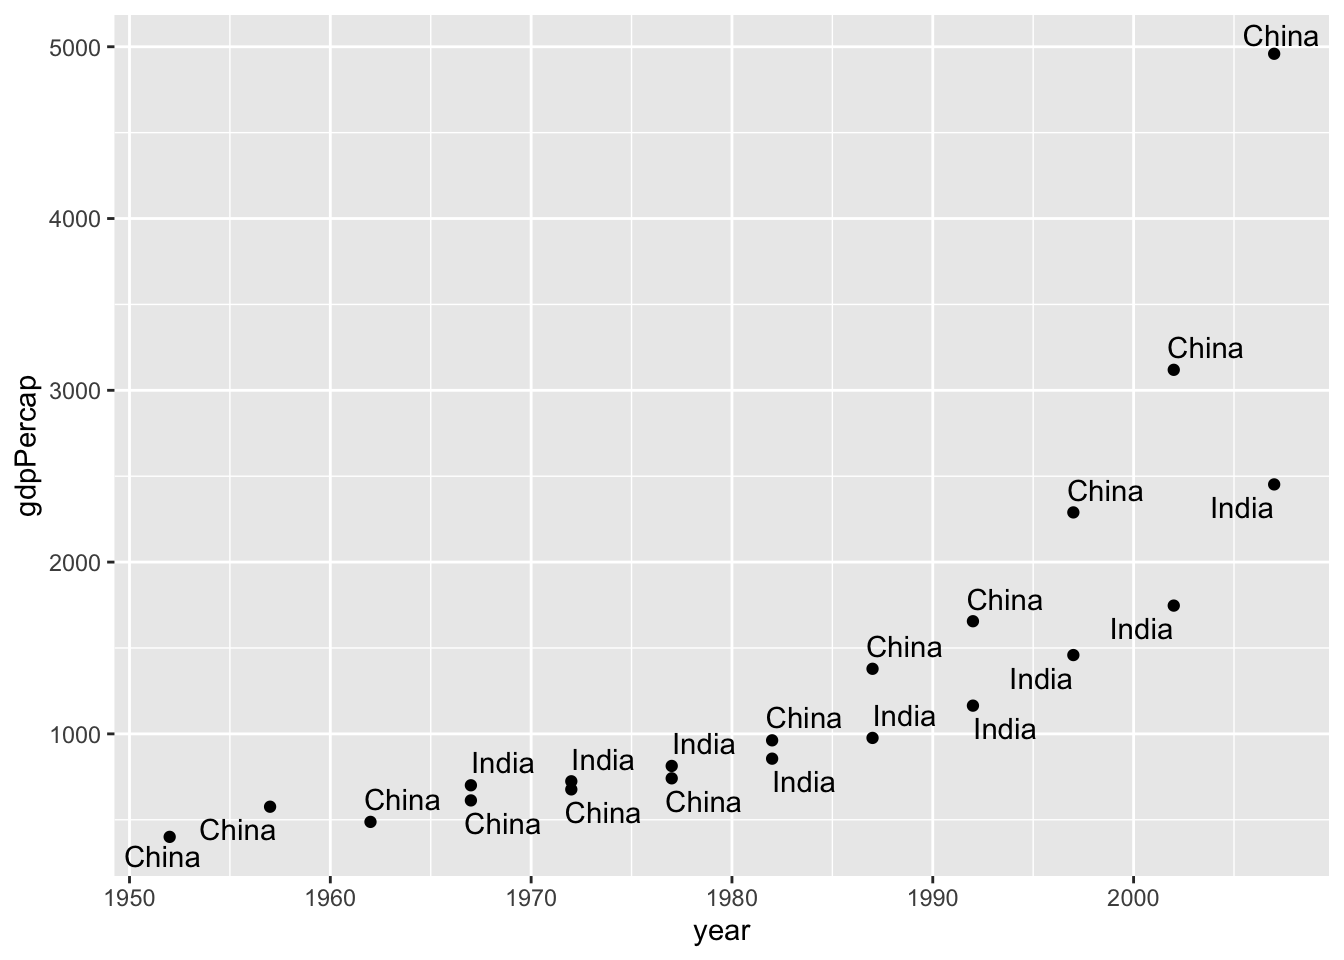
Use a filter to reduce the size of the data and then label points on a scatterplot using geom_text_repel
library(ggrepel)
hi_pop_countries <- filter(gapminder,
                           pop > 500000000)
ggplot(hi_pop_countries,
       aes(x = year, y = gdpPercap)) +
       geom_point() +
       geom_text_repel(aes(label = country))
Explore the storms dataset
The data() command lists all dataset included with R and the Tidyverse. Note that the storms data is in dplyr.
Use filter and varioius geoms geom_point(), geom_histogram(), geom_boxplot(). to compare storms across time.