Shiny by Examples
Data 309: Week 11
The following examples demonstrate some basic usage of RShiny. They increase in complexity from 1-10. Somehow I skipped Example 3. Study each and submit your own shiny app, modified as you see fit, and I’ll choose my favorite and it to the list so there are ten examples.
Example 1
app-basic1.R : A basic Shiny app that plots the graph of a function and also a point on it parametrized by a slider. To run, simply copy & paste the script into RStudio, save and click Run App.

Example 2
app-basic2.R : This builds on the app-basic1.R by adding a new layer to the plot and by adding an interactive table to the display.

Example 4
app-basic4.R : This builds on the app-basic2.R by using plotly for graphics and palmerpenguins for data.

Example 5
app-basic5.R : This builds on the app-basic4.R by still using plotly for graphics and palmerpenguins for data, but adding a select button.

Example 6
app-basic6.R : Here we add a new statistic: a window, or neighborhood, about the current value of the slider and use that to filter as a modification of app-basic5.R.

Example 7
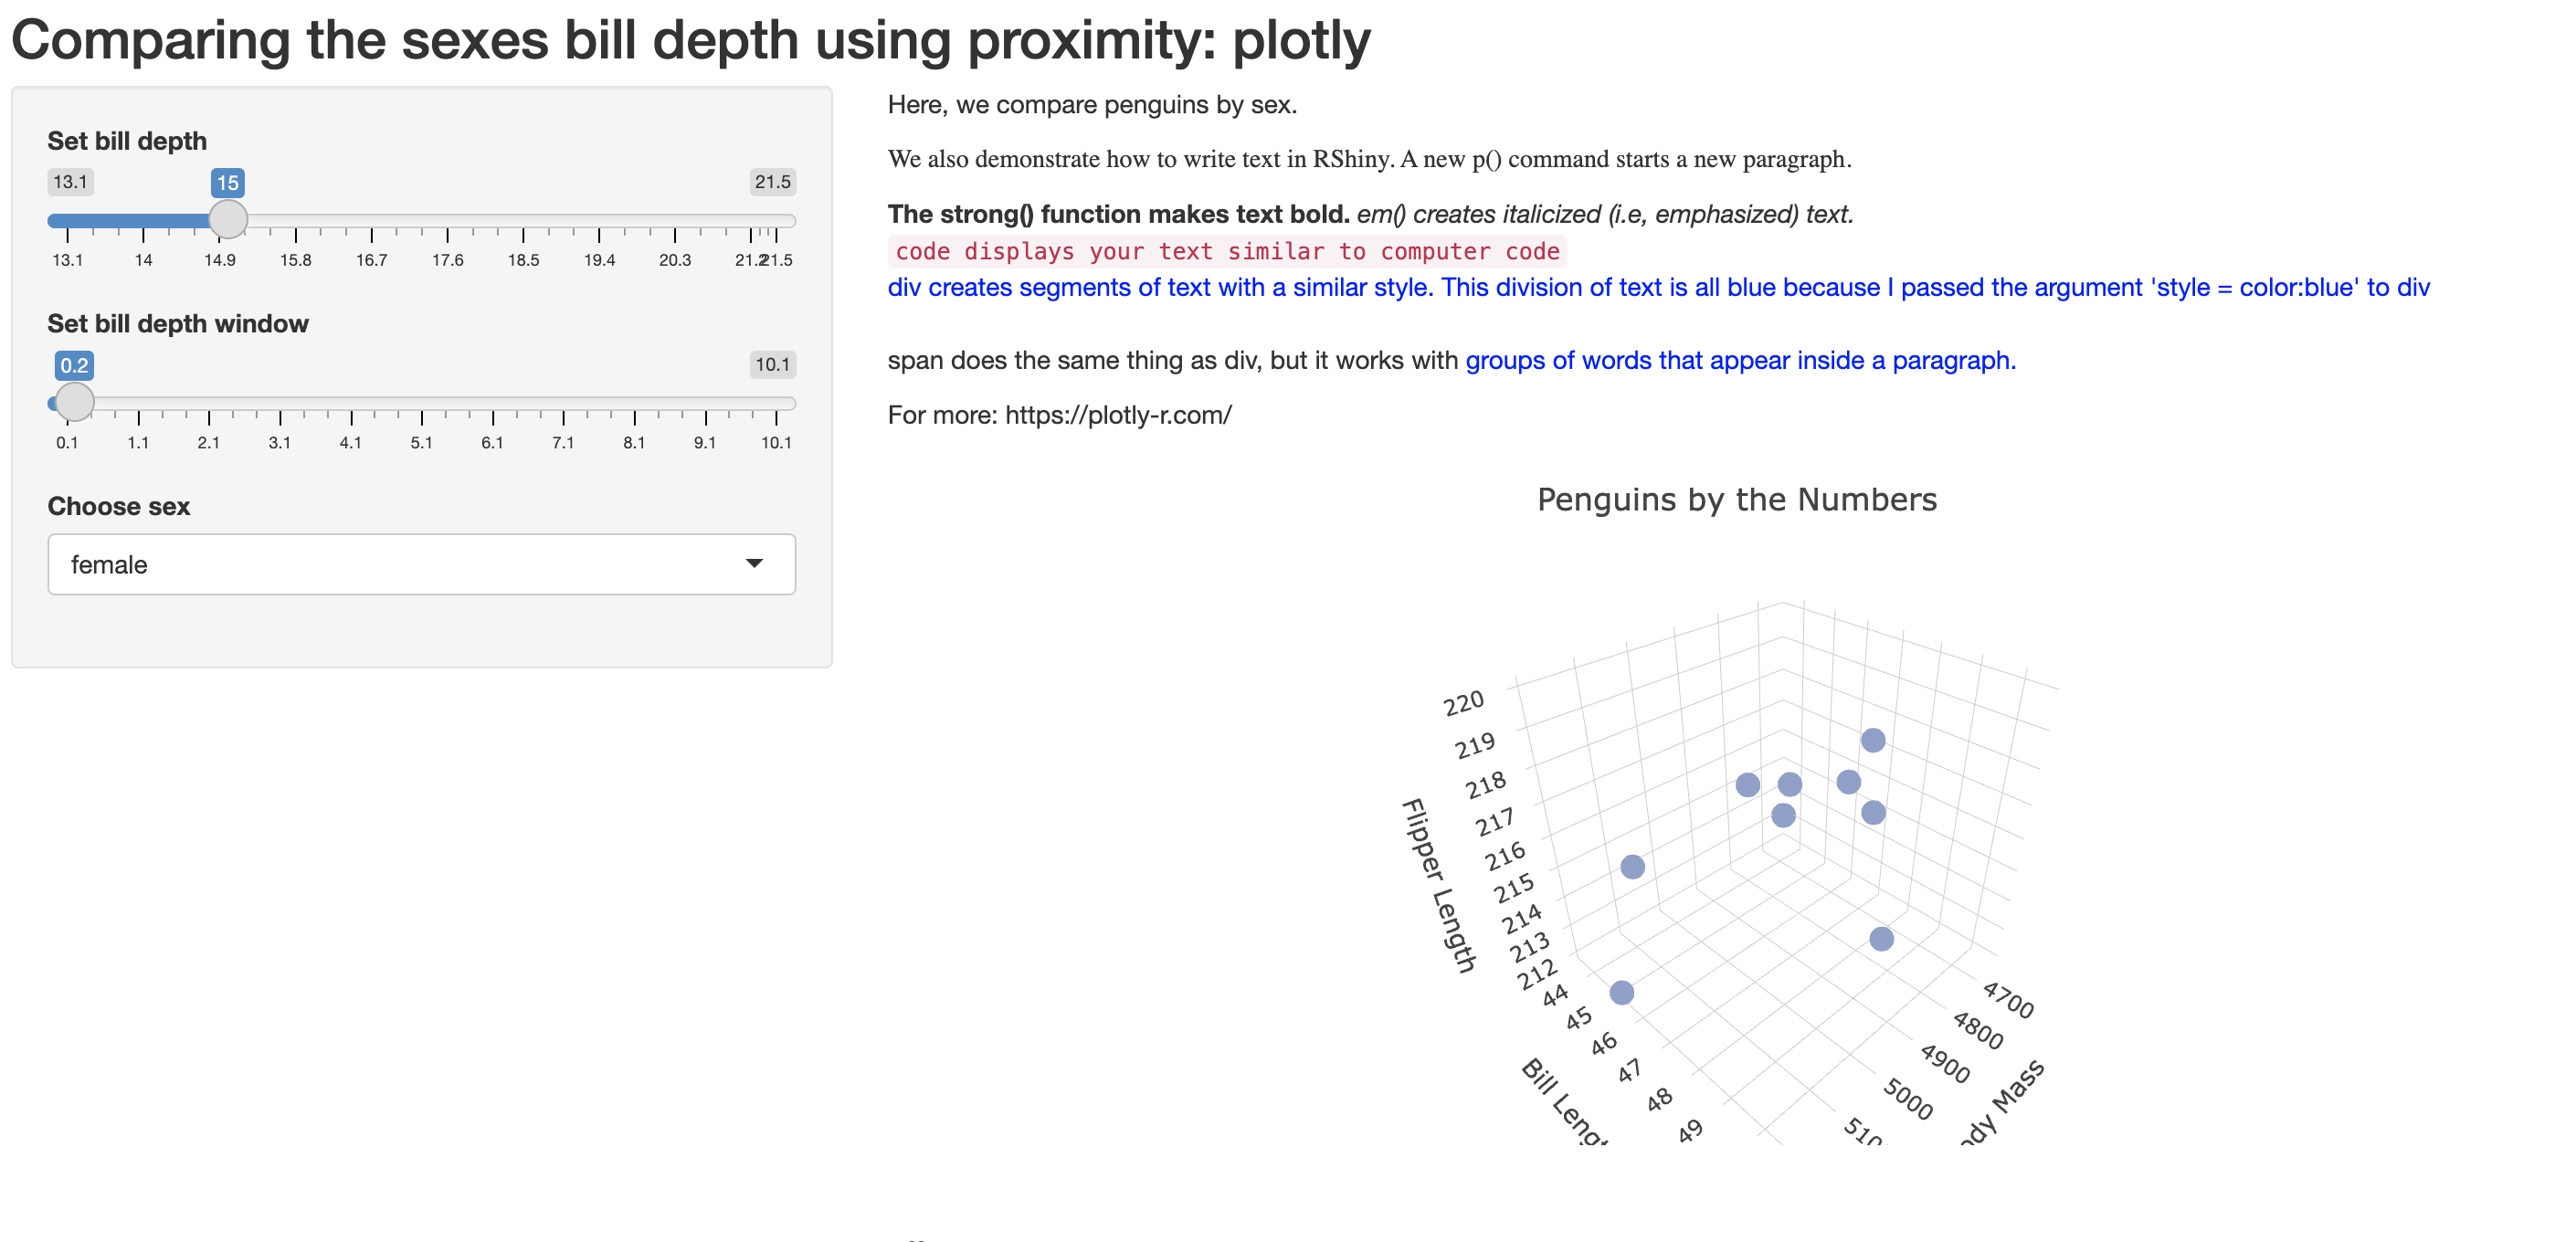
app-basic7.R : Continuing the modification of app-basic6.R, we now have two sliders, one selection box, one plot and we add an output of variations of printed text in paragraph form.)

Example 8
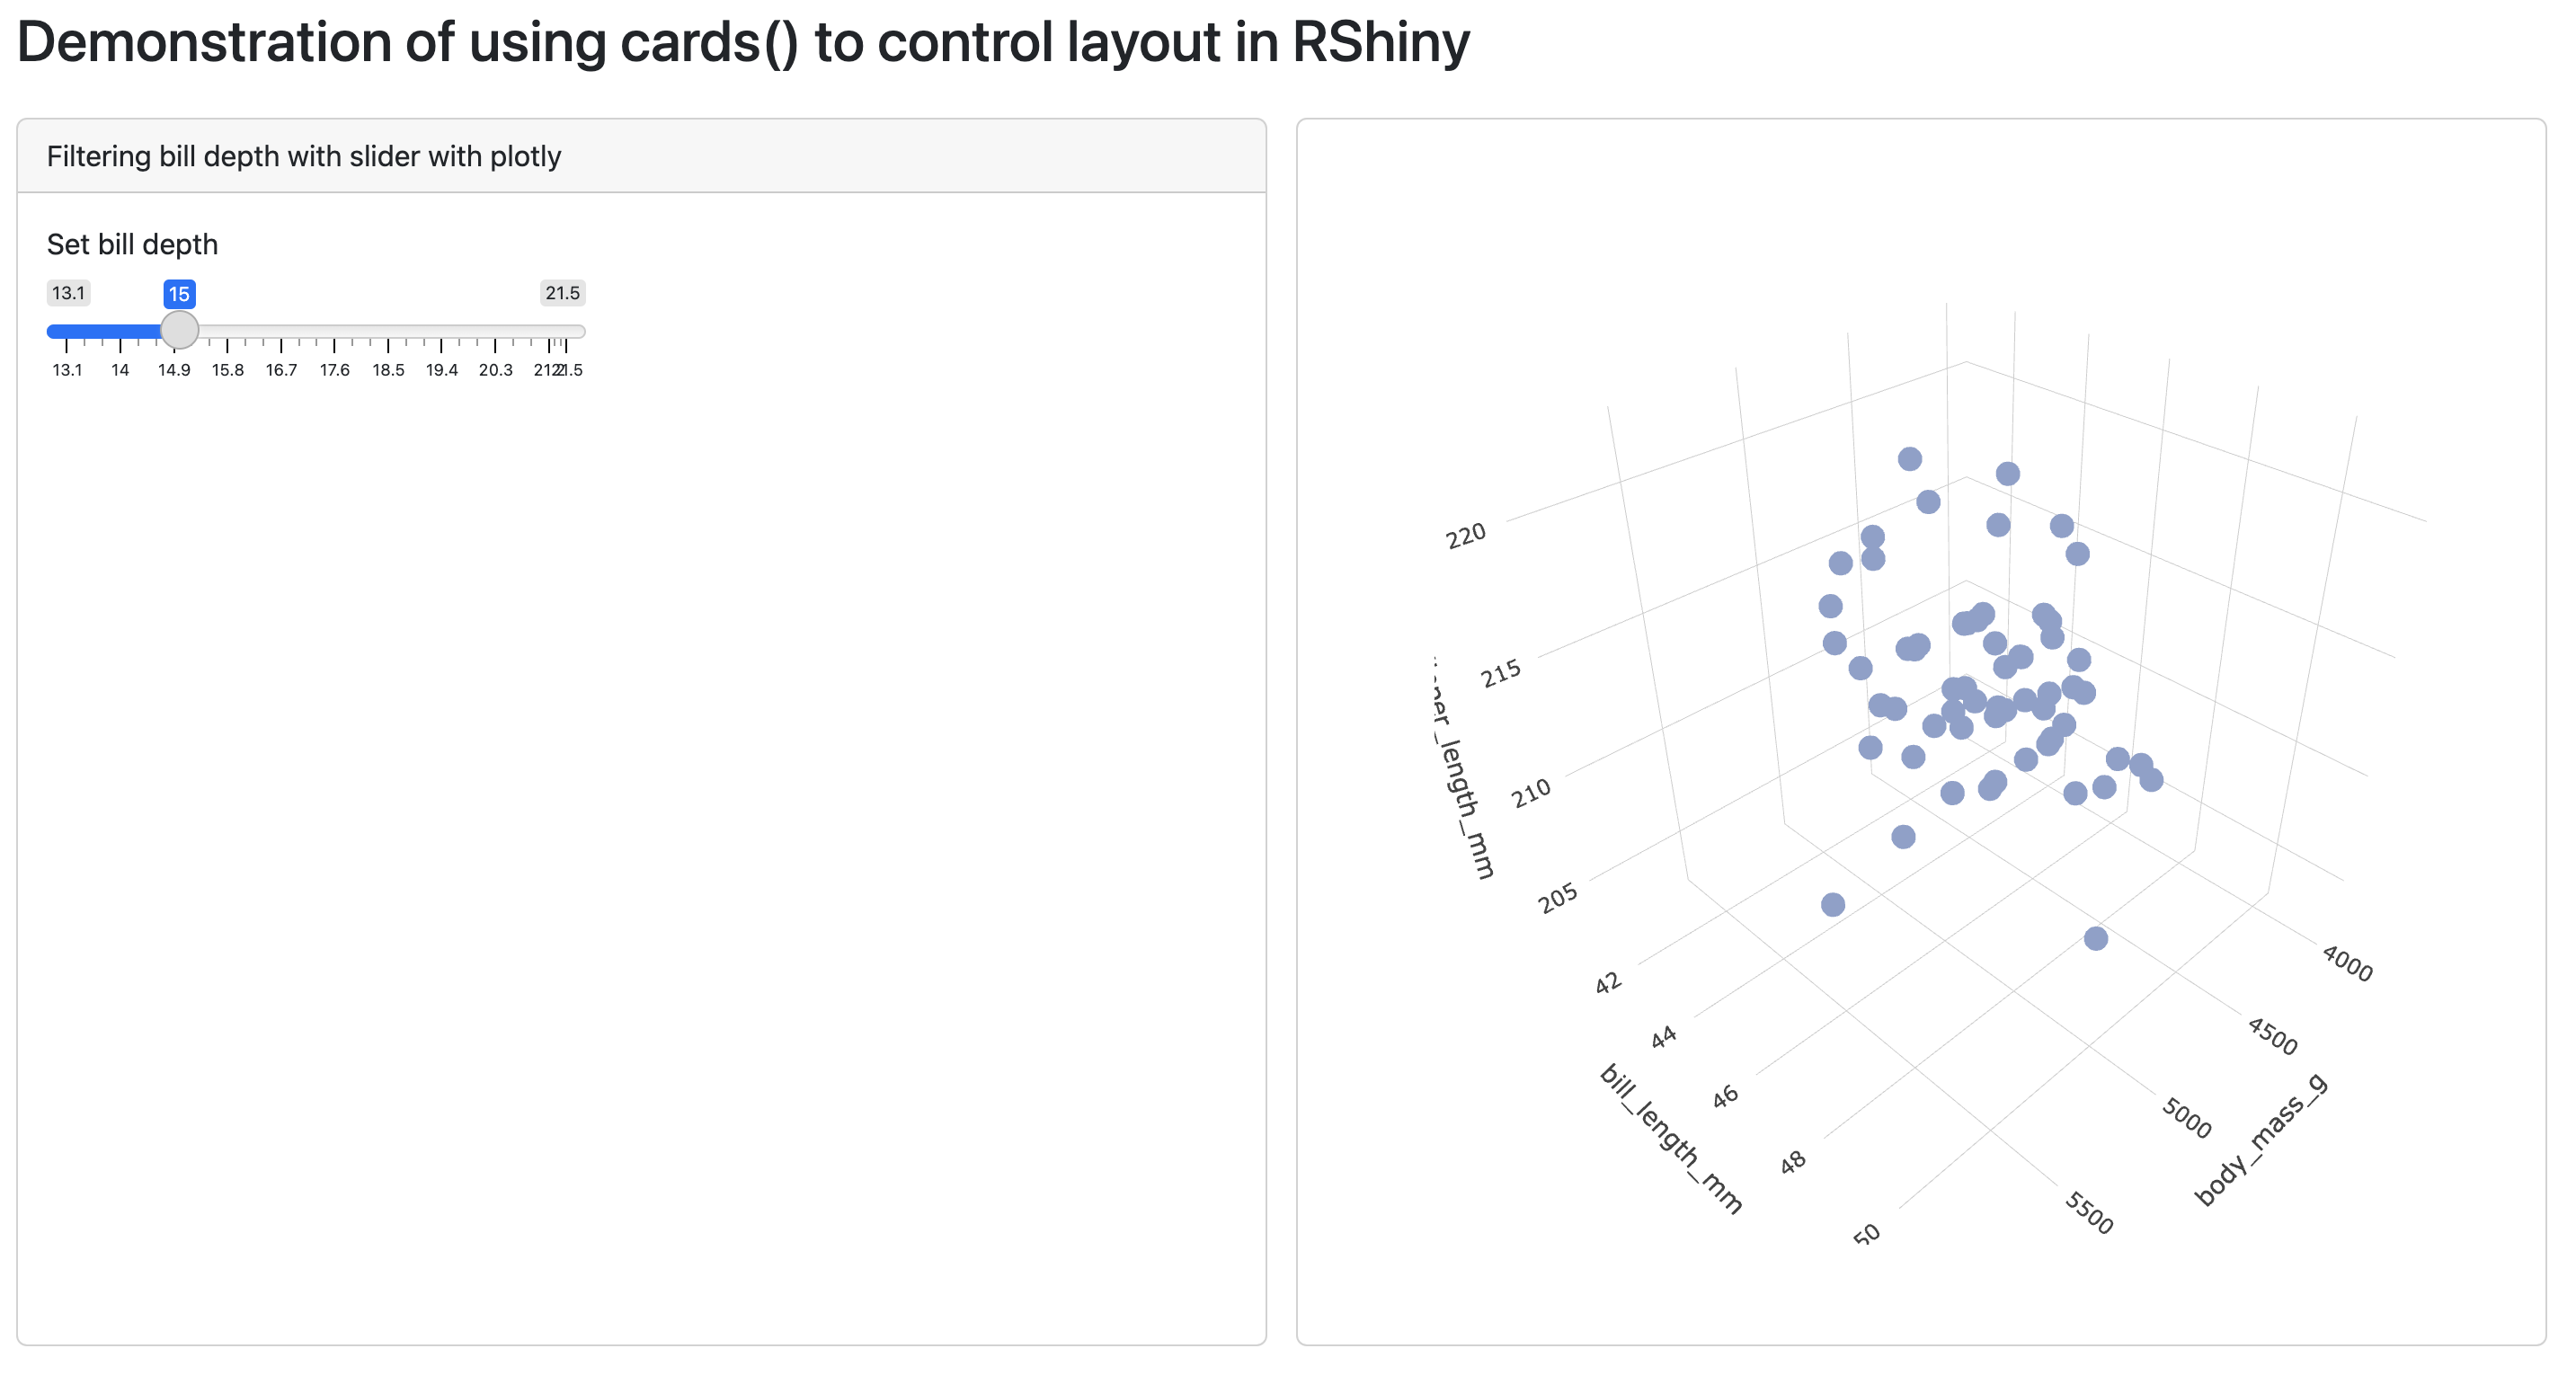
app-basic8.R : Here we go back and modify a simple app (app-basic4.R) to now use card() to affect the layout or visual display of content. This card() places a border around output and includes many options for customization.

Example 9
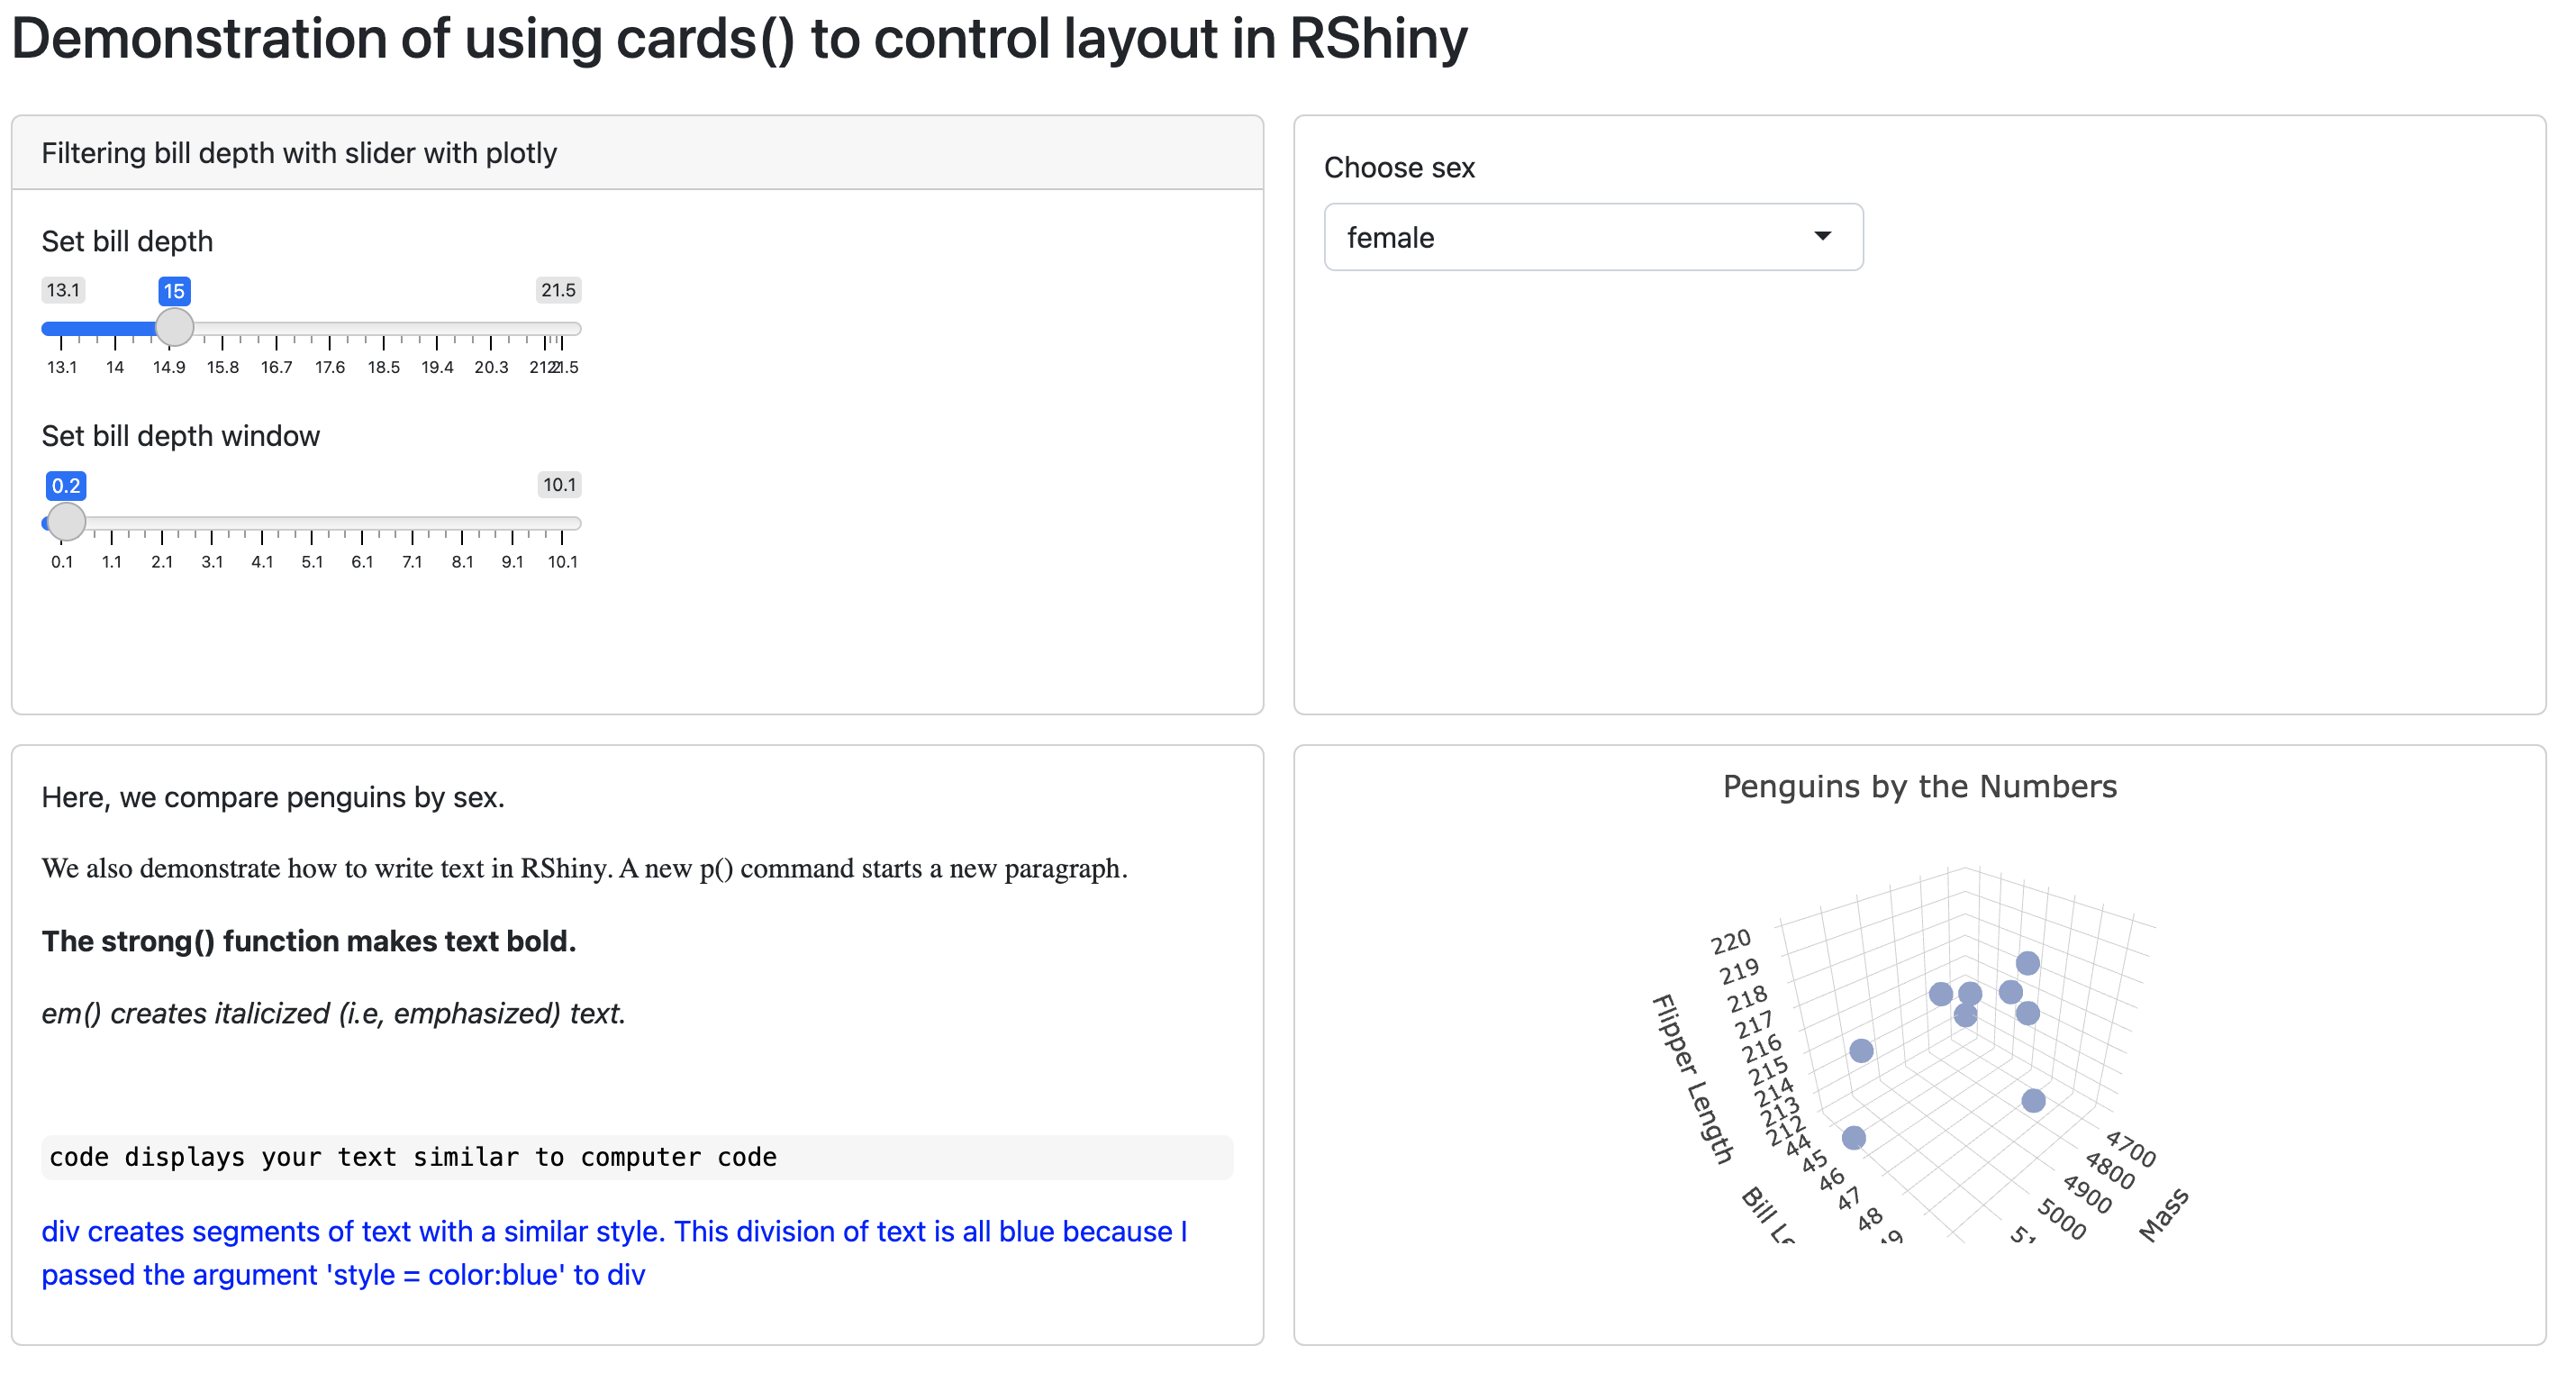
app-basic9.R : Here we go back and modify a busier app (app-basic7.R) to now use card() to affect the layout or visual display of content. Notice how content scrolls within a card(), and how some have titles.

Example 10
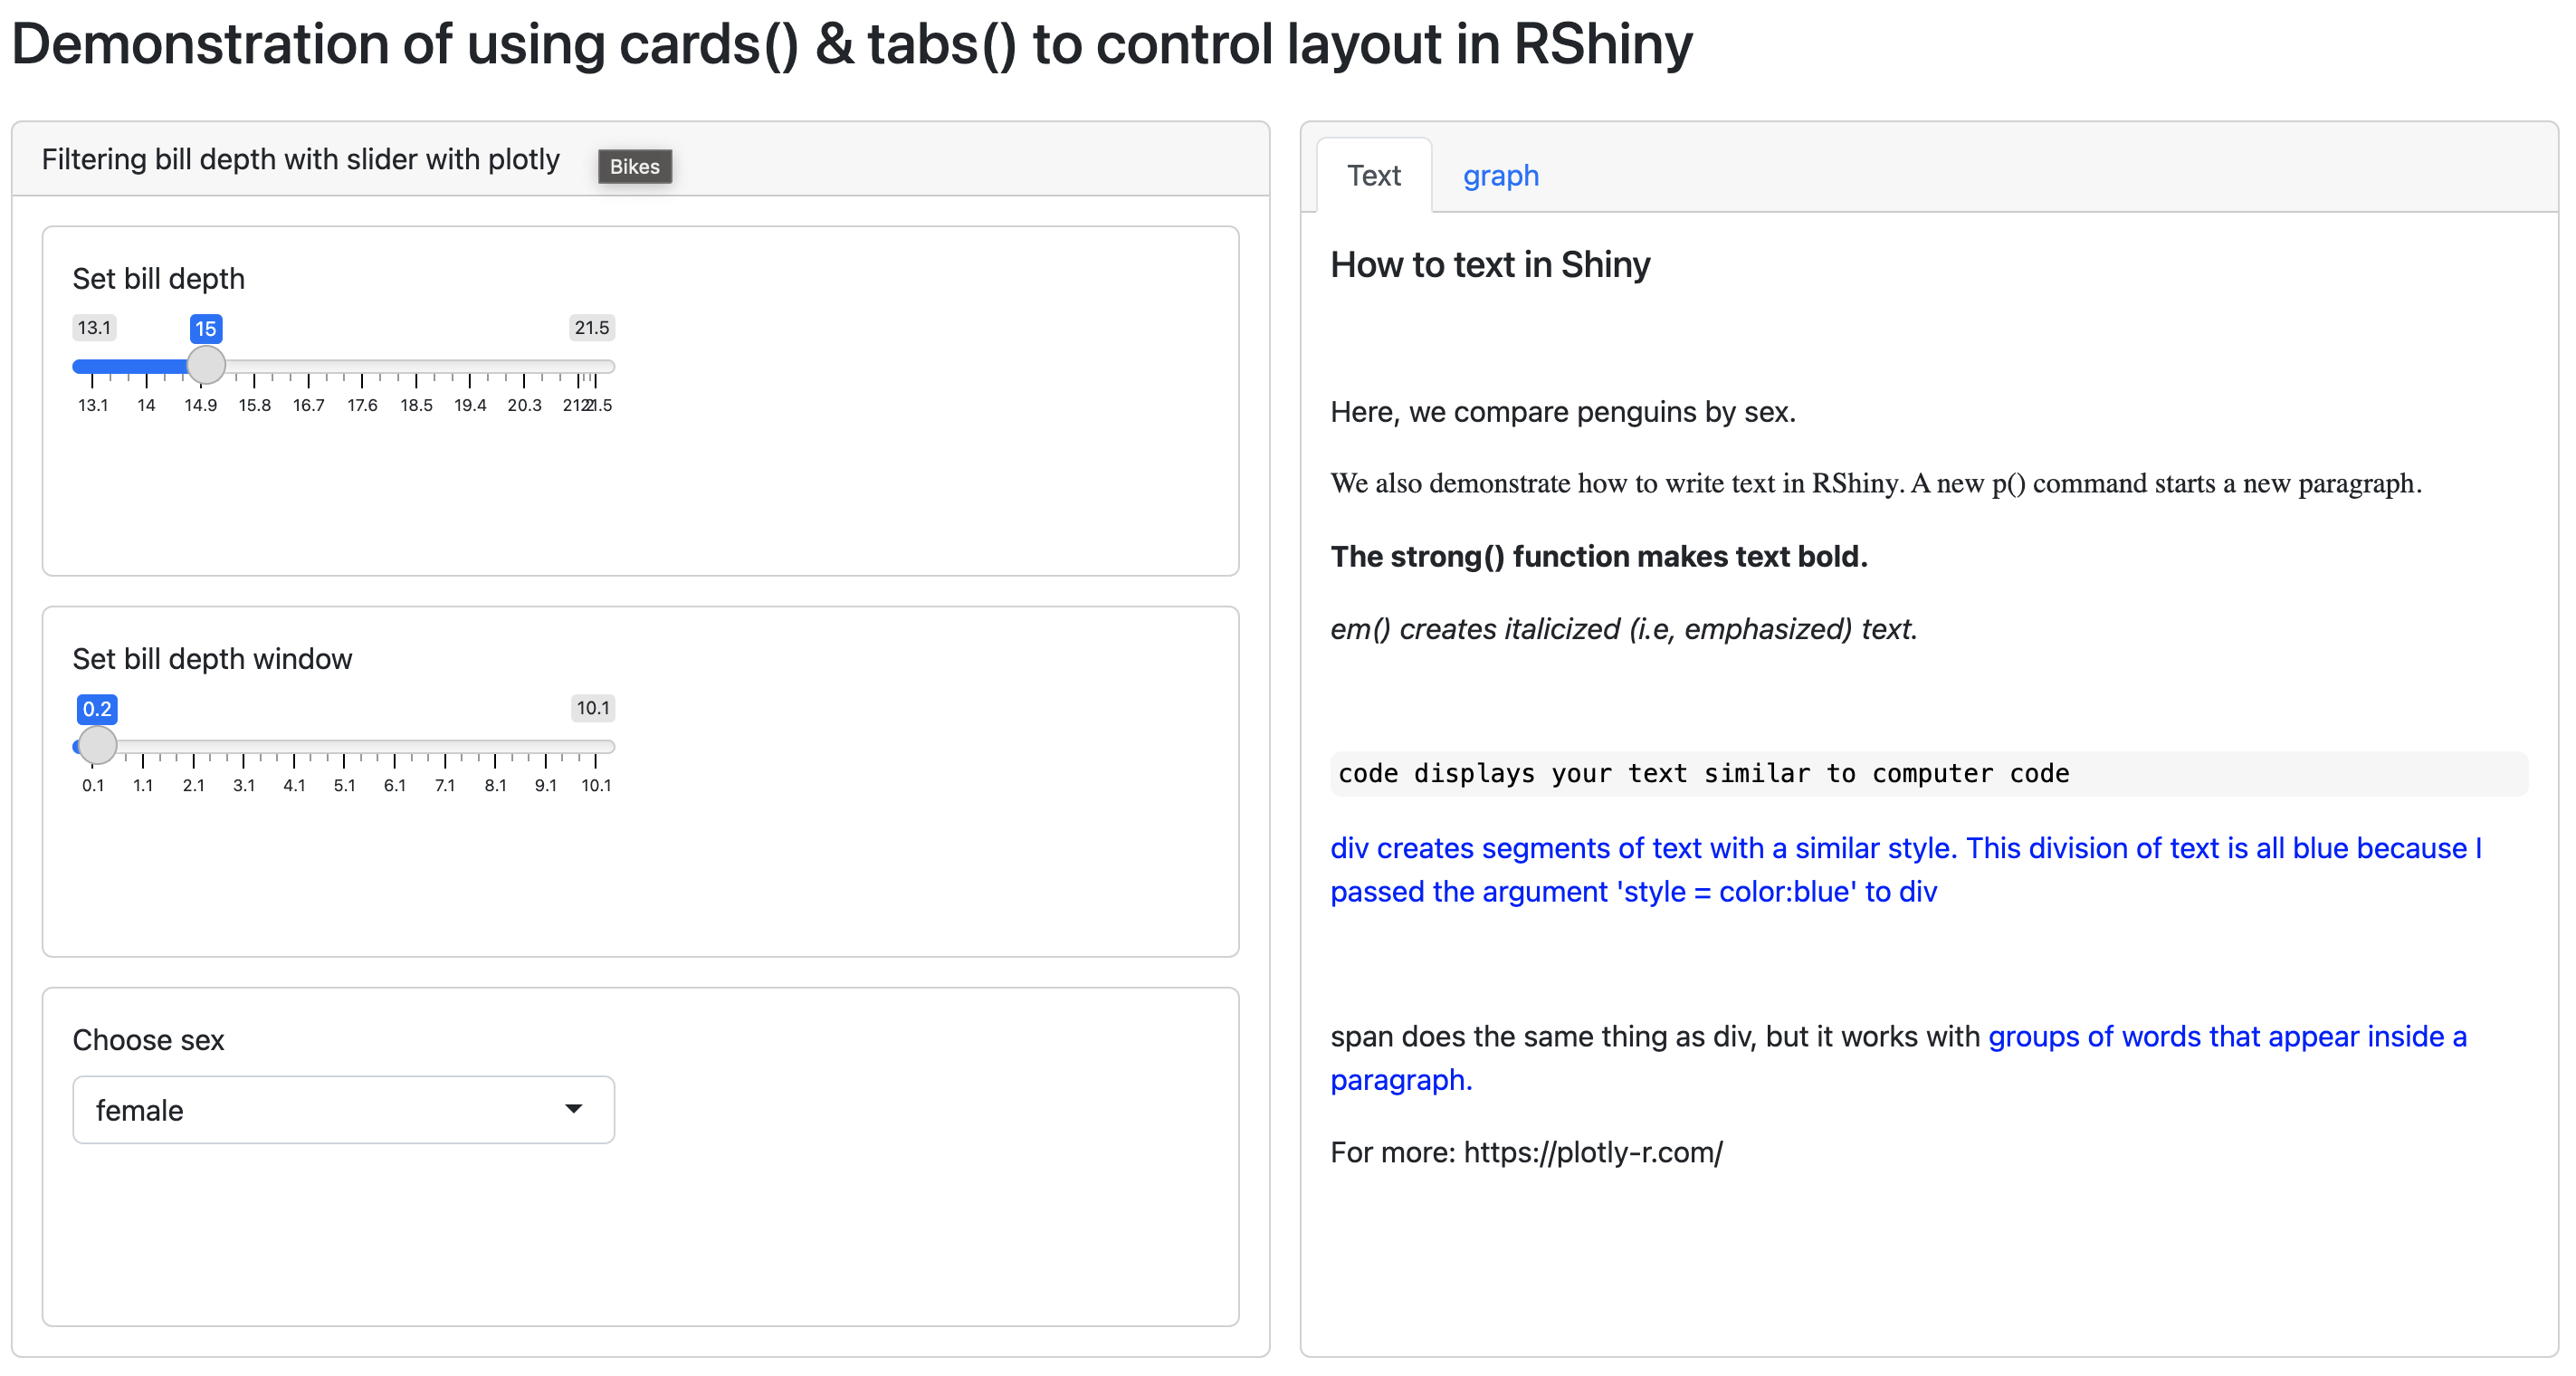
app-basic10.R : Here we modify (app-basic9.R) by adding a tab. Within a card() is a set of tabs that can toggled to quickly change viewing content. Also, we next card() within a card() to make it seem like we two columns; column one w/three rows, column two w/one row.
