How many different planes are there in the flights data? How many airports?
Did every plane visit every airport?
Create a data frame of the most delayed flight (departure) from each airport.
Categorize continuous data with cut()
cut divides the range of x into intervals and codes the values in x according to which interval they fall.
Use cut()
Code
library(tidyverse)
atus <- read_rds("/Users/josh/Google Drive/Teaching/DAT309/Week2/ATUS2/ATUS_data") |>
  janitor::clean_names()

df <- mutate(atus, work_level = cut(act_work,
  breaks = c(0,60,60*9,60*24),
  labels = c("low","medium","high")),
  .before = 1)
Exercise with cut()
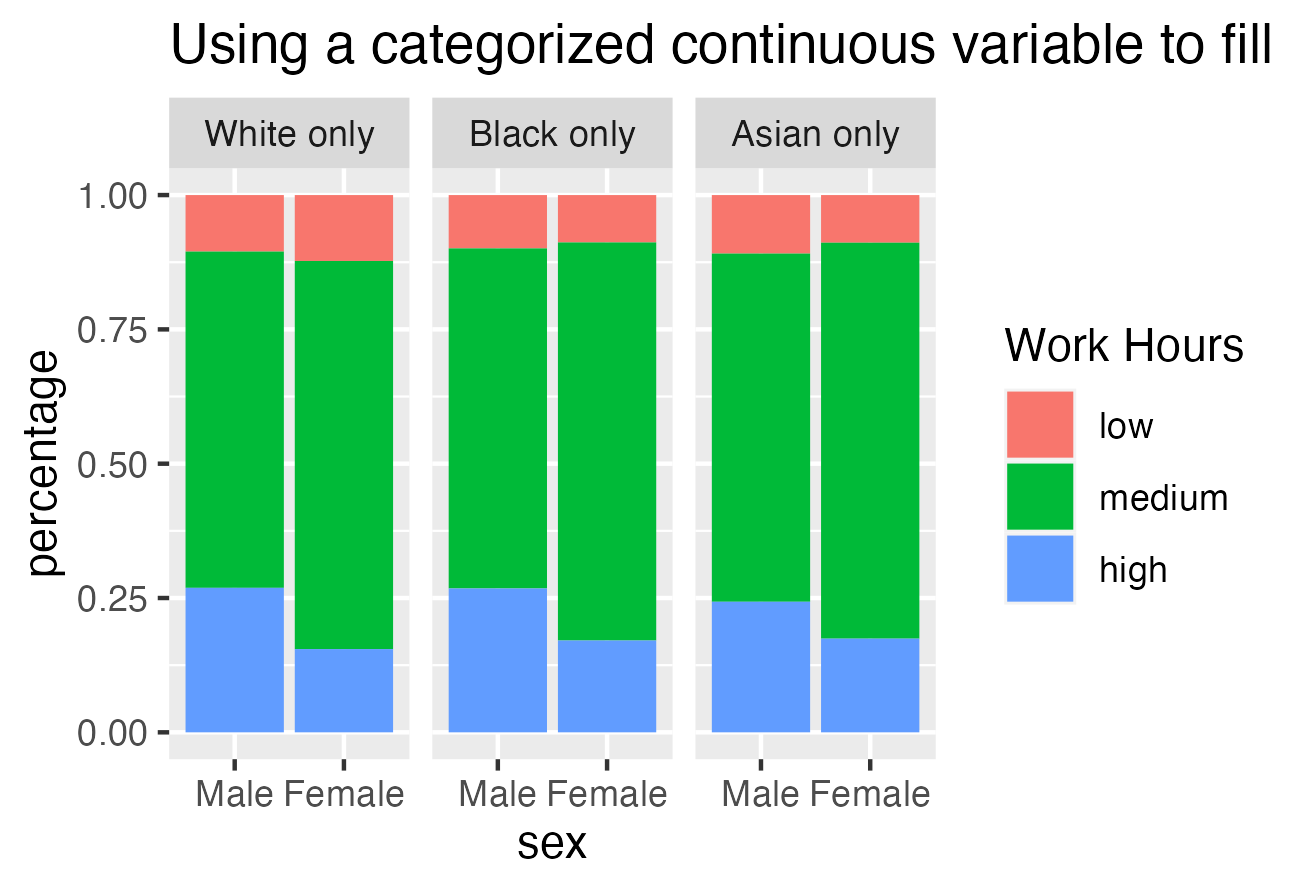
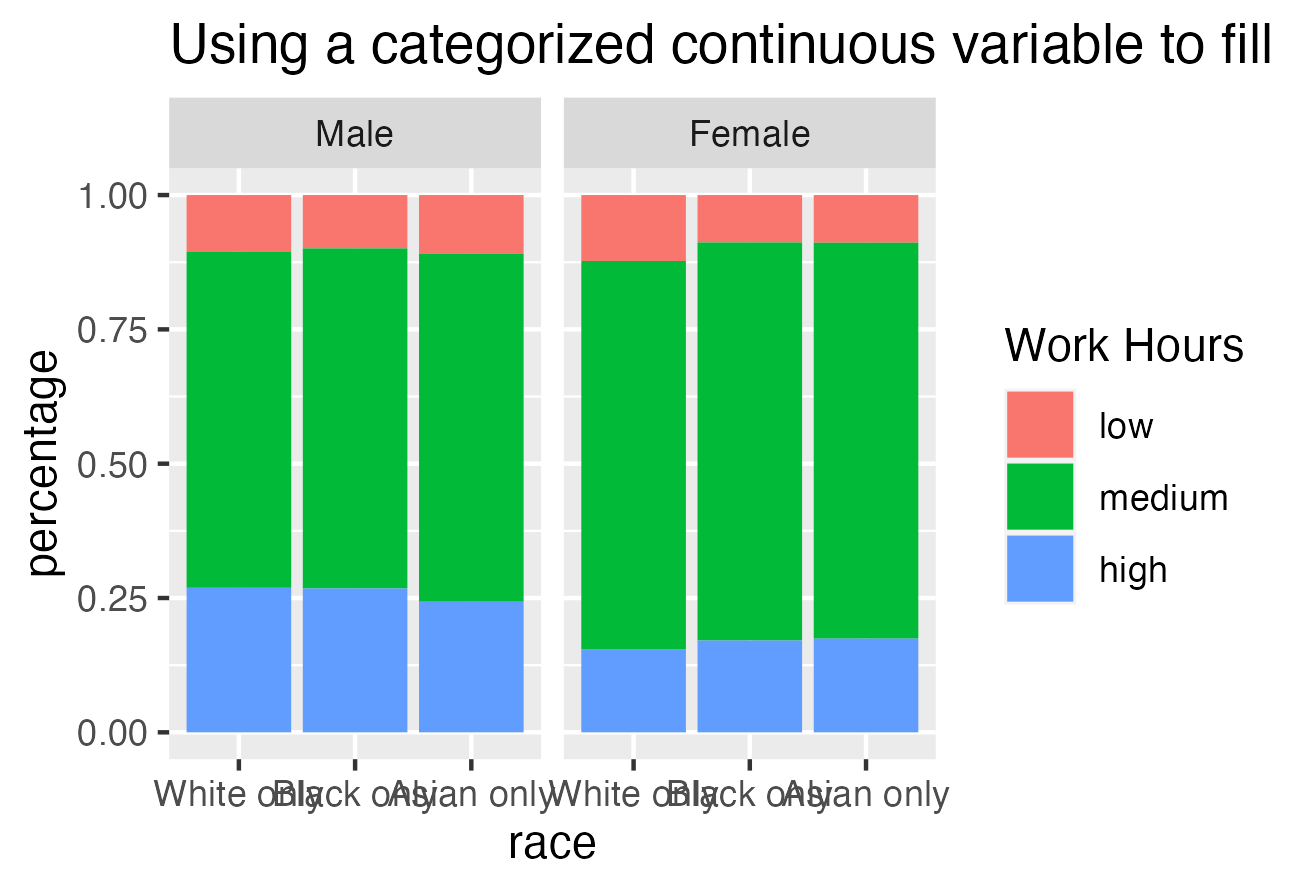
- Re-create a nice-looking plot of the ATUS data that uses
cut() to create a category of based on the numerical data of act_work:

Which is the better plot?


