Working with data inevitably leads to the need to filter out subsets, to sort data based on some rule and to find the unique observations. We often need to create new variables as modifications of existing ones. Some variables are often more important than others, thus we need to select them. Finally, renaming and moving variables to within view often makes working with data easier. The tools you learn here make all this possible.
Data Transformations
| filter |
mutate |
| arrange |
select |
| distinct |
rename |
|
relocate |
|
select |
Row Functions
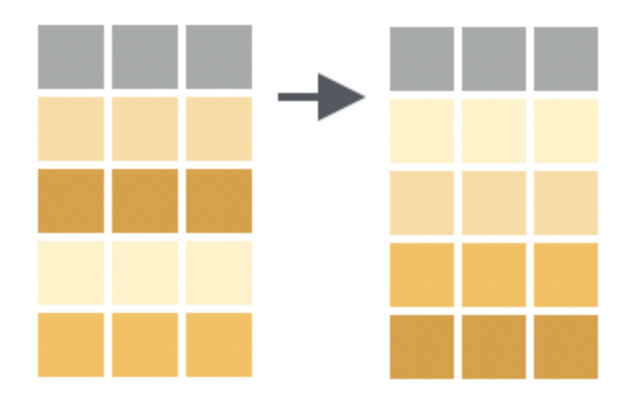
These functions change which rows are present in the data and keep the columns the same.
Filter observations based on conditions
Subset oberservations (rows) based on a logical condition.
Textbook link: filter

Arrange rows by value in ascending order
Textbook link: arrange

This permutes the ordering of the rows. (Note the r in arrange, r for rows.) If you provide more than one column name, each additional column will be used to break ties in the values of preceding columns. To arrange in descending order use desc().
Code
# A tibble: 336,776 × 19
    year month   day dep_time sched_dep_time dep_delay arr_time sched_arr_time
   <int> <int> <int>    <int>          <int>     <dbl>    <int>          <int>
 1  2013     1    13        1           2249        72      108           2357
 2  2013     1    31        1           2100       181      124           2225
 3  2013     1     9        2           2359         3      432            444
 4  2013     1    13        2           2359         3      502            444
 5  2013     1    16        2           2125       157      119           2250
 6  2013     1    10        3           2359         4      426            437
 7  2013     1    13        3           2030       213      340           2350
 8  2013     1    16        3           1946       257      212           2154
 9  2013     1    30        3           2159       124      100           2306
10  2013     1    31        4           2359         5      455            444
# ℹ 336,766 more rows
# ℹ 11 more variables: arr_delay <dbl>, carrier <chr>, flight <int>,
#   tailnum <chr>, origin <chr>, dest <chr>, air_time <dbl>, distance <dbl>,
#   hour <dbl>, minute <dbl>, time_hour <dttm>
Keep distinct rows
Use distinct on several column names to find unique combinations. The .keep_all = TRUE argument is used to retain all columsns
Code
# A tibble: 224 × 2
   origin dest
   <chr>  <chr>
 1 EWR    IAH
 2 LGA    IAH
 3 JFK    MIA
 4 JFK    BQN
 5 LGA    ATL
 6 EWR    ORD
 7 EWR    FLL
 8 LGA    IAD
 9 JFK    MCO
10 LGA    ORD
# ℹ 214 more rows
Column functions
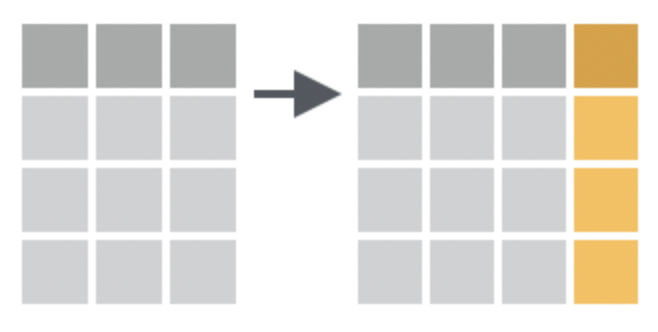
Create new variables

Textbook link: mutate
Add new variables (columns), usually via a formula involving existing ones. Use these helper functions to relocate or newly created variables.
.before = 1.after = some_var_name
Code
# A tibble: 344 × 9
   bill_num species island    bill_length_mm bill_depth_mm flipper_length_mm
      <dbl> <fct>   <fct>              <dbl>         <dbl>             <int>
 1     57.8 Adelie  Torgersen           39.1          18.7               181
 2     56.9 Adelie  Torgersen           39.5          17.4               186
 3     58.3 Adelie  Torgersen           40.3          18                 195
 4     NA   Adelie  Torgersen           NA            NA                  NA
 5     56   Adelie  Torgersen           36.7          19.3               193
 6     59.9 Adelie  Torgersen           39.3          20.6               190
 7     56.7 Adelie  Torgersen           38.9          17.8               181
 8     58.8 Adelie  Torgersen           39.2          19.6               195
 9     52.2 Adelie  Torgersen           34.1          18.1               193
10     62.2 Adelie  Torgersen           42            20.2               190
# ℹ 334 more rows
# ℹ 3 more variables: body_mass_g <int>, sex <fct>, year <int>
Select columns based on a logical test
This is useful if you have too many columns, choose which columns you wish to view.
Textbook link: select

Select tips & helper functions
- use : to select a range
- use ! to exclude
- use
where with is.factor(), or is.numeric(), or is.character()
-
starts_with("abc"): matches names that begin with “abc”.
-
ends_with("xyz"): matches names that end with “xyz”.
-
contains("ijk"): matches names that contain “ijk”.
-
num_range("x", 1:3): matches x1, x2 and x3.
- To drop colummns:
select(data,-c(this_col,that_col))
- use regular expressions:
select(matches("o.*u"))
Note: o.*u is a regular expression that matches an o followed by a u with any number of characters in between. country and population are returned because the names country and population each contain an o followed (at any distance) by a u.
Exercise
Use select() and these helper functions to create various subsets of penguins data.
Permute the ordering of columns (notice the c in relocate, c for columns)
You can also achieve this with select()


