Matrices And Color
This page describes how one can think of a digital images as a vector in a vector space. Essentially, one rearranges the pixel values from the rectangular shape of an image into a one-diminsional list of real numbers (usually integers in [0,255].
Contents
The Image Function
The MATLAB function "image.m" creates an image from a matrix. You pass it the matrix, scaled to have values in [0,1], and it converts each entry in the matrix to a color. Since any color can basically be thought of as a combination of three primary colors (red-green-blue), you can create a full color image by creating a "3-dimensional matrix", or cube.
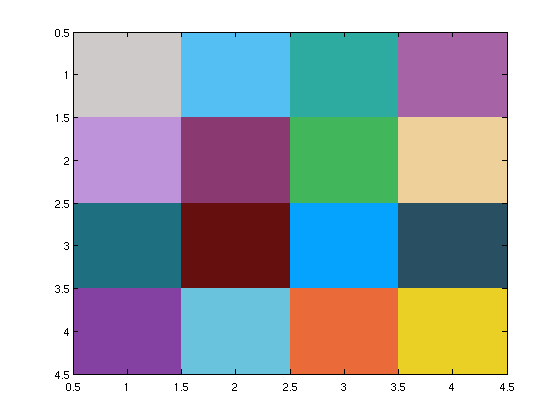
RandomColorMatrix = 255*rand(4,4,3)
figure;
RandomColorMatrix(:,:,1) =

  206.3470   83.0876   46.0881  166.6935
  190.8978  139.3446   65.1236  237.8165
   30.6477  101.7146    5.2366   41.6957
  133.8865  105.8488  235.5373  234.8798


RandomColorMatrix(:,:,2) =

  202.6378  191.7463  171.1566   99.6443
  147.2355   58.3107  182.3792  208.1157
  112.2091   16.3677  163.7255   80.9441
   65.6915  195.6690  106.8573  207.7076


RandomColorMatrix(:,:,3) =

  201.2137  242.4781  160.9531  166.3750
  217.3273  113.2109   90.5438  154.2726
  128.9373   15.3048  254.2358   98.7476
  162.0937  221.0212   57.1637   36.2577

A random color matrix (3 different matrices, stacked like pancakes)
image(1/255*RandomColorMatrix);
A random greyscale matrix (1 random matrix, copied and stacked)
A random can be seen in several different, but really equivalent ways. The first is as either a red, green or blue sheet. MyColors will be a "black matrix" filled with zeros, RandomMatrix is filled with random numbers in [0,1].
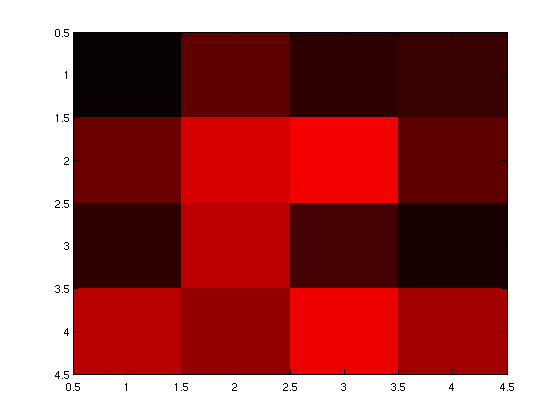
RandomMatrix = round(255*rand(4,4))
RandomMatrix =

     6    94    45    57
   107   215   244    95
    47   187    68    22
   185   146   236   163
In red
MyColors = zeros(4,4,3);
MyColors(:,:,1) = RandomMatrix;
figure;
image(1/255*MyColors);
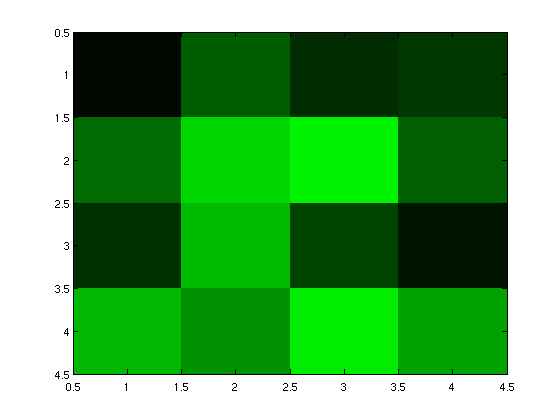
In green
MyColors = zeros(4,4,3);
MyColors(:,:,2) = RandomMatrix;
figure;
image(1/255*MyColors);
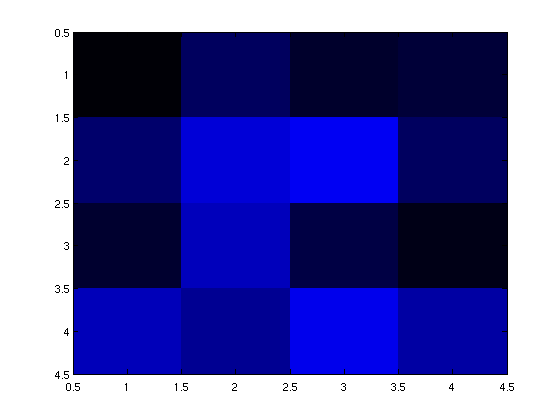
In blue
MyColors = zeros(4,4,3);
MyColors(:,:,3) = RandomMatrix;
figure;
image(1/255*MyColors);
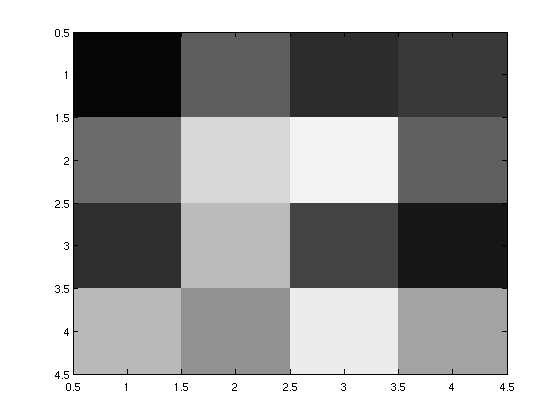
In grey
MyColors = zeros(4,4,3);
MyColors(:,:,1) = RandomMatrix;
MyColors(:,:,2) = RandomMatrix;
MyColors(:,:,3) = RandomMatrix;
figure;
image(1/255*MyColors);
Linear combinations of color
Any color can be thought of as a kind of "linear combination" of three basis colors, red, green and blue. For example, if
zero_matrix = zeros(4,4,3);
red = zero_matrix;
	red(:,:,1) = ones(4);
green = zero_matrix;
	green(:,:,2) = ones(4);
blue = zero_matrix;
	blue(:,:,3) = ones(4);
% then white is
% To see this color we can map the three components of the vector to the three color components expected by the image function (after scaling appropriately).
White as the linear combination
white = 255*red + 255*green + 255*blue;
figure;
image(1/255*white);
Animations of many linear combinations
%Prepare the new file.
	Vid = VideoWriter('deform_blue');
	open(Vid);
	h =  []; % Initial handle to plot
	k = 1; % Index of snapshot
	MyFig = figure; hold on;
	axis off
	set(gca,'nextplot','replacechildren','visible','off')

% Let the coefficient of the blue vector vary from 0 to 255, and plot the results
for c = 0:255
	FunnyColor = 45*red + 35*green + c*blue;
	MaxValue = max(max(max(FunnyColor)));
	image(1/MaxValue*FunnyColor);
	frame = getframe(MyFig);
 	writeVideo(Vid,frame);
end
close(Vid);