library(ggplot)
install.packages("ggstats")Using & Interpreting Linear Models
w/ggstats
ggstats: additional stats package for ggplot
The ggstats package provides new statistics, new geometries and new positions for ggplot2 and a suite of functions to facilitate the creation of statistical plots.
- Install
ggstatsas shown below.
- You may need to update
ggplot. - Learn more here
library(ggstats)swiss dataset & the lm() function
The swiss dataset is a classic dataset of Fertility & Socioeconomic Indicators in Switzerland in 1888.
# skim the help file
?swiss
With the function lm() we fit a linear model to data. Specifically, we’ll use regression: Estimating the relationship between a dependent variable and one or more independent variables.
Below we predict the Fertility variable based on the other data in swiss (least squares regression). The coefficients of the model are contained in mod1 and can be used to determine the strength of our model.
# compute a least squares regression
mod1 <- lm(Fertility ~ ., data = swiss)

print(mod1)
Call:
lm(formula = Fertility ~ ., data = swiss)

Coefficients:
     (Intercept)       Agriculture       Examination         Education
         66.9152           -0.1721           -0.2580           -0.8709
        Catholic  Infant.Mortality
          0.1041            1.0770
quick visualization of lm() output
The ggstats package allows for quick viewing of the coefficients.
Remember p-value < 0.05 ( 5 % ) usually means statistically significant. The Beta value on the x-axis represents the magnitude & direction between the variables, i.e., (+/- coorelation)
ggcoef_model(mod1, plot_title = "Predicting Fertility")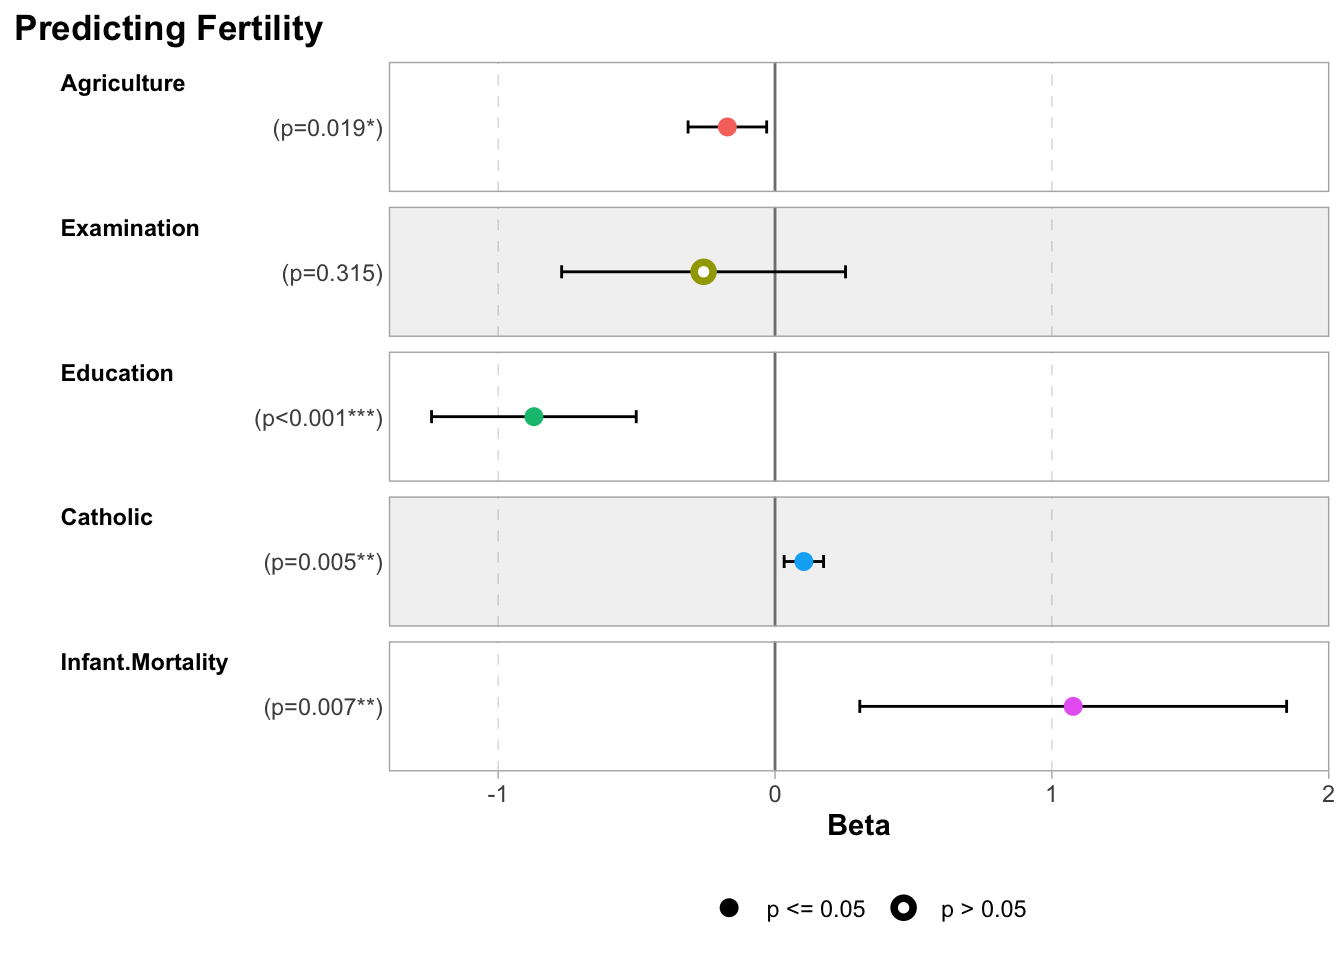
questions
- Based on the plot, what variable is most highly coorelated with Fertility?
- Which variable has no significant impact on Fertility?
- Apply these data-viz techniques to the
penguins. You will have to select only the numeric variables first. - Repeat but after you create a new variable called
bill_ratio = bill_length_mm / bill_depth_mm