*One of the more important achievements of the human development approach, as embodied in successive HDRs, has been to ensure a growing acceptance of the fact that monetary measures, such as GDP per capita, are inadequate proxies of development. The first Human Development Report introduced the Human Development Index (HDI) as a measure of achievement in the basic dimensions of human development across countries.
This somewhat crude measure of human development remains a simple unweighted average of a nation’s longevity, education and income and is widely accepted in development discourse. Over the years, however, some modifications and refinements have been made to the index. Indeed, the critics of the HDI and their concerns have stimulated – and continue to stimulate - adjustments to the index and the development of companion indices which help paint a broader picture of global human development.*
Excel Files
Who likes Excel? Here is what the data looks like in a google sheet.
Notice the data isn’t tidy. For example, see row 5 and notice how it seems like to different tables; A-B and C-O.
We can import specific ranges of the sheet and merge them in tidy way within R.
library(tidyverse)# download the entire file# note that the name will be called file.xlsxdownload.file("https://disq.us/url?url=https%3A%2F%2Fhdr.undp.org%2Fsites%2Fdefault%2Ffiles%2F2021-22_HDR%2FHDR21-22_Statistical_Annex_HDI_Table.xlsx%3A9O8Pba_UHXZTr36XYc2Ev7O5B1Y&cuid=5289028", destfile ="file.xlsx", quiet =TRUE, mode ="wb")# read/load a specific range of the excel fileHDI.countries <- readxl::read_excel("file.xlsx", range ="A6:B191") |>filter(row_number() >1) |> janitor::clean_names()# read in a different range of cells from the excel fileHDI.data <- readxl::read_excel("file.xlsx", range ="C5:M191") |>filter(row_number() >2) |>mutate_all(as.numeric) |> janitor::clean_names()# check for errorsnrow(HDI.countries) # should be the same
[1] 184
nrow(HDI.data)
[1] 184
Merge Data Frames
We know (assume, actually) that the rows of each dataset are ordered the same so we use bind_cols.
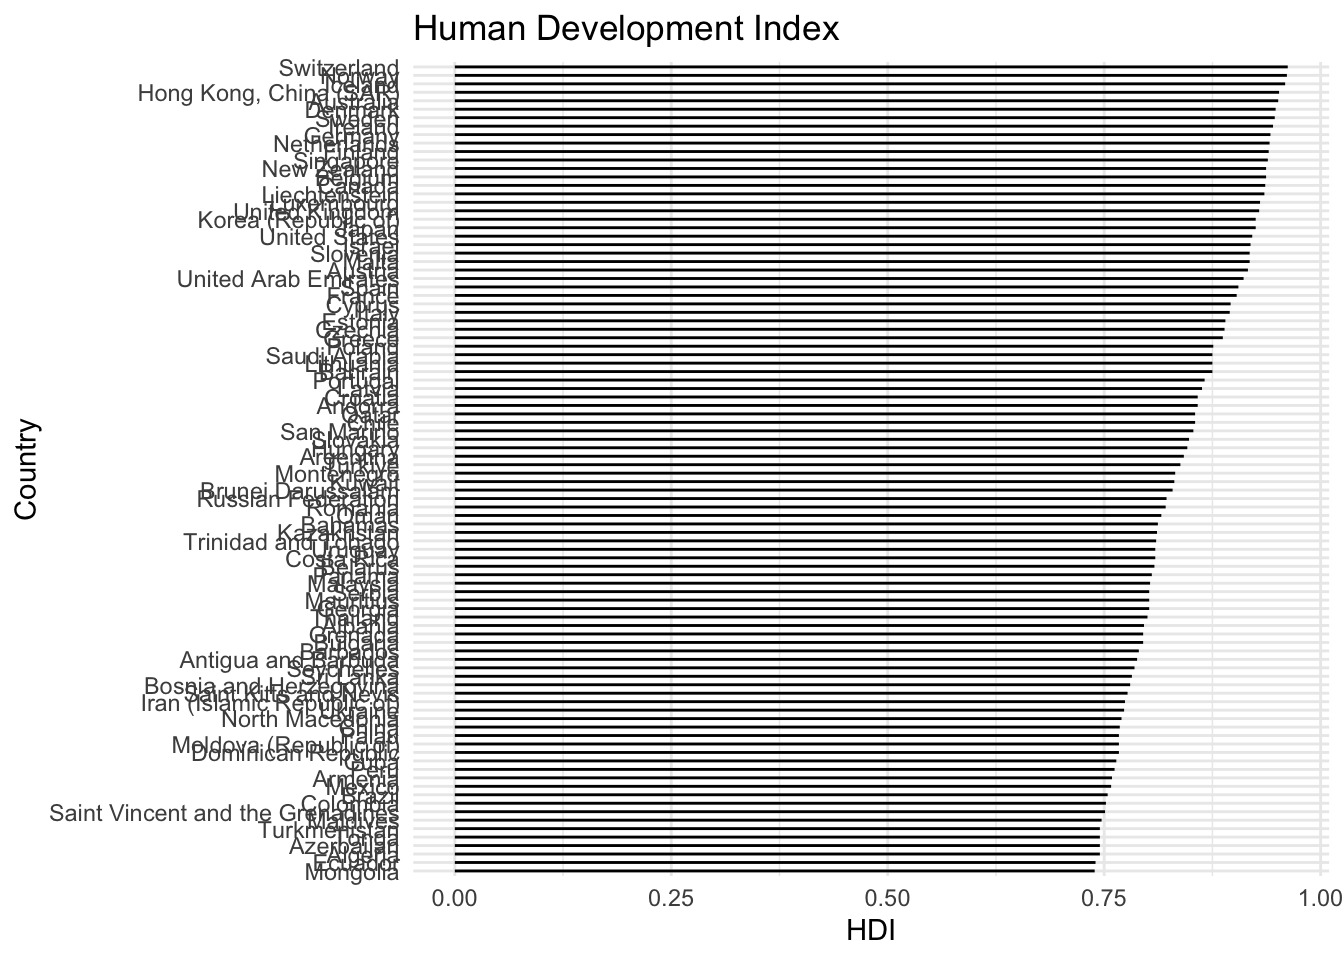
See the human-development-index varies among countries.
HDI |>filter(hdi >mean(hdi)) |>mutate(country =reorder(country,hdi)) |>ggplot() +geom_segment(aes(x=0,xend=hdi,y=country,yend=country)) +labs(title ='Human Development Index',x ='HDI', y ='Country') +theme_minimal()
Improve the plot above by:
reduce the number of countries to improve readability
change it up by using quantile(hdi)[4] or
change up the filter by using quantile(HDI$hdi,prob=seq(0,1,by=.1))[10]
can you explain what the previous line does?
Save your data
We worked hard to create this data, let’s save it so we don’t lose our work.
write_rds(HDI,"hdi.data")
You could now close RStudio and not lose your data. Load it again with:
hdi_new <-read_rds("hdi.data")
Download a file from the internet from within R
You may wish to download some data you find on the web. This is a nice way to avoid all the pointing and clicking.
# this grabs the file and stores in your current directory# curious where this is? getwd() to find out wheredownload.file(url ="https://euclid.nmu.edu/~joshthom/teaching/dat309/week6/hdi.data",destfile ="hdi.data")
Read the file in exactly as above.
# this data was a tibble in R that I saved using# write_rds(HDI,"hdi.data"), hdi <-read_rds("hdi.data")