library(tidyverse)
library(readxl)

download.file("https://content.cld.iop.org/journals/1748-9326/15/9/093001/revision2/ERL_15_9_093001_suppdata.xlsx?Expires=1761662467&Signature=imS1jdUF7ZYwuTkOqaQ6DLP-HikDOp1whUtrGqvf081HSbELclst-4TgdDIsB1cXkcLQbiS4X97HLqIgUjFMOpipGrQKIvcdF6CaBDgrYikUl-lEHr63CFFjVtLFmhc1XRWnsYBZ2V0JPzZksetKR3Z-cZuM2QQVtSLFfZObBVT6JjmWRwus1NLxtGywAW7JsBzd-QQkEc5M56jVrHhd~qvLOQbqJtphvPjIN0O7ipr7oIdrFZrYjsVRShERirku5FelLBYOmWqGR6-TTbVU8jGVWzSTmey9IKMC~Q-bw-~tD1JkrMFp731mPoLoMWozYaoVF65jkQWfiTmhY9ZRkA__&Key-Pair-Id=KL1D8TIY3N7T8", destfile = 'climate-consumption.xlsx')

# This file also lives in the dat309/week9/ directory
# The sheet named 'options' is the one we want
cd <- read_excel("climate-consumption.xlsx",sheet = 'options') |>
janitor::clean_names()Climate & Consumption
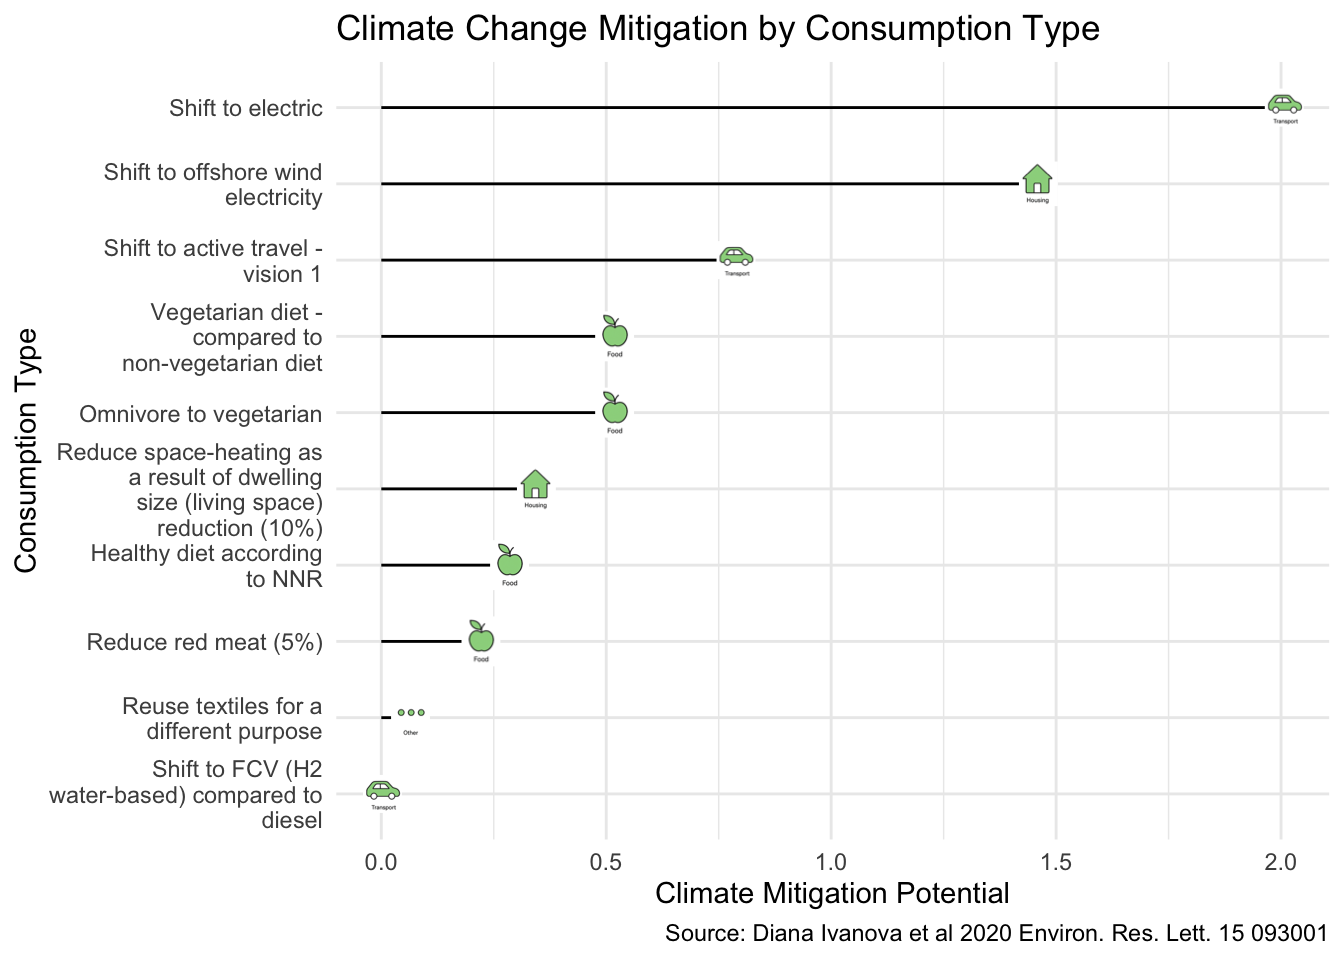
lollipop-type chart with icons
What behavioral changes most help the environment?
This paper: Quantifying the potential for climate change mitigation of consumption options addresses this question.
From the paper:
Background Around two-thirds of global GHG emissions are directly and indirectly linked to household consumption, with a global average of about 6 tCO2eq/cap. The average per capita carbon footprint of North America and Europe amount to 13.4 and 7.5 tCO2eq/cap, respectively, while that of Africa and the Middle East—to 1.7 tCO2eq/cap on average. Changes in consumption patterns to low-carbon alternatives therefore present a great and urgently required potential for emission reductions. In this paper, we synthesize emission mitigation potentials across the consumption domains of food, housing, transport and other consumption.
Methods We systematically screened 6990 records in the Web of Science Core Collections and Scopus. Searches were restricted to (1) reviews of lifecycle assessment studies and (2) multiregional input-output studies of household consumption, published after 2011 in English. We selected against pre-determined eligibility criteria and quantitatively synthesized findings from 53 studies in a meta-review. We identified 771 original options, which we summarized and presented in 61 consumption options with a positive mitigation potential. We used a fixed-effects model to explore the role of contextual factors (geographical, technical and socio-demographic factors) for the outcome variable (mitigation potential per capita) within consumption options.
Load the Excel File
Plot Icons on a Lolipop Graph
- Create some icons (draw them yourself or ai)
- Save them locally. . It’s too much work to create 500+ icons, so I just create 4 to represent the 4 basic types of consumption.
- Mutate in the paths to the icons for each type.
cd <- cd |> mutate(icon_path = case_when(
    consumption_domain == 'Food' ~ '~/t/dat309/figs/food.png',
    consumption_domain == 'Housing' ~ '~/t/dat309/figs/housing.png',
    consumption_domain == 'Other consumption' ~ '~/t/dat309/figs/other.png',
    consumption_domain == 'Transport' ~ '~/t/dat309/figs/transport.png',
))- Use
geom_image()to plot the icon atop the global aesthetic. - Subset the data into random subset of 10 consumption types for easy comparison.
library(scales)
library(ggimage) # may need to upgrade systemfonts too
# randomly sample the data for ease of visibility
df <- cd |> slice_sample(n=10) |>
    # reorder based on the mean variable
    mutate(original_consumption_options =
    reorder(original_consumption_options,mean))
The Plot
Run the code multiple times to generate different plots with different Consumption Types
# lollipop-type graph, with image as the candy
df |>
    ggplot(aes(y=original_consumption_options, x = mean)) +
    geom_segment(aes(
        x=0,xend=mean,
        y=original_consumption_options, yend=original_consumption_options))  +
    # notice the global aes() tells geom_image where to put the icon
    geom_image(aes(image=icon_path)) +
    labs(x = 'Climate Mitigation Potential',
        y = 'Consumption Type',
        title = 'Climate Change Mitigation by Consumption Type',
        caption ='Source: Diana Ivanova et al 2020 Environ. Res. Lett. 15 093001') +
    # wrap the long lines of consumption type
    scale_y_discrete(labels = label_wrap(25)) +
    # left justify if you want
    # theme(axis.text.y = element_text(hjust=0)) +
    theme_minimal()