library(tidyverse)
# load housing data for each county
zil <- read_csv("https://euclid.nmu.edu/~joshthom/teaching/dat309/week9/County_zhvi_uc_sfrcondo_tier_0.33_0.67_sm_sa_month_2025.csv")

# clean names
zil <- janitor::clean_names(zil)Basic Map with Zillow Data
Coloring Counties with Data
Load Zillow Data
On the Zillow Data page, one can download ZHVI data for each county in the US. Data for 2025 was saved in the week9 folder. Import below:
Compute a row-wise mean of all columns starting with x. This is an alternative to pivoting and computing the mean.
zil_df <- zil |>
  rowwise() |>
  mutate(value = mean(c_across(starts_with('x')), na.rm = TRUE)) |>
  ungroup() |>
  select(-starts_with('x'))
Create a county fips code
The plot_usmap() function requires the fips code for plotting. The alternative is to use lat/lon pairs together with geom_polygon().
The zillow data comes with a state fips code and a municipal fips code we glue together to define a county fips code.
# still need to make a county fips code
zil_df <- mutate(
  zil_df,
  fips = as.character(
    paste0(
      state_code_fips,
      municipal_code_fips)
  )) |> relocate(fips)
Join Zillow data with Fips data
The us_map() function creates a variable called geom used to plot a polygon representing each county.
Join the geometry data with the zillow data using the fips code.
library(usmap)
county_map_data = us_map(regions = 'counties')
zil_joined <- inner_join(zil_df, county_map_data)
Find the mean home value for each county.
# summary
zil_summary <- zil_joined |>
group_by(region_name, state_name, fips, geom) |>
summarize(mean = mean(value, na.rm=TRUE)) |>
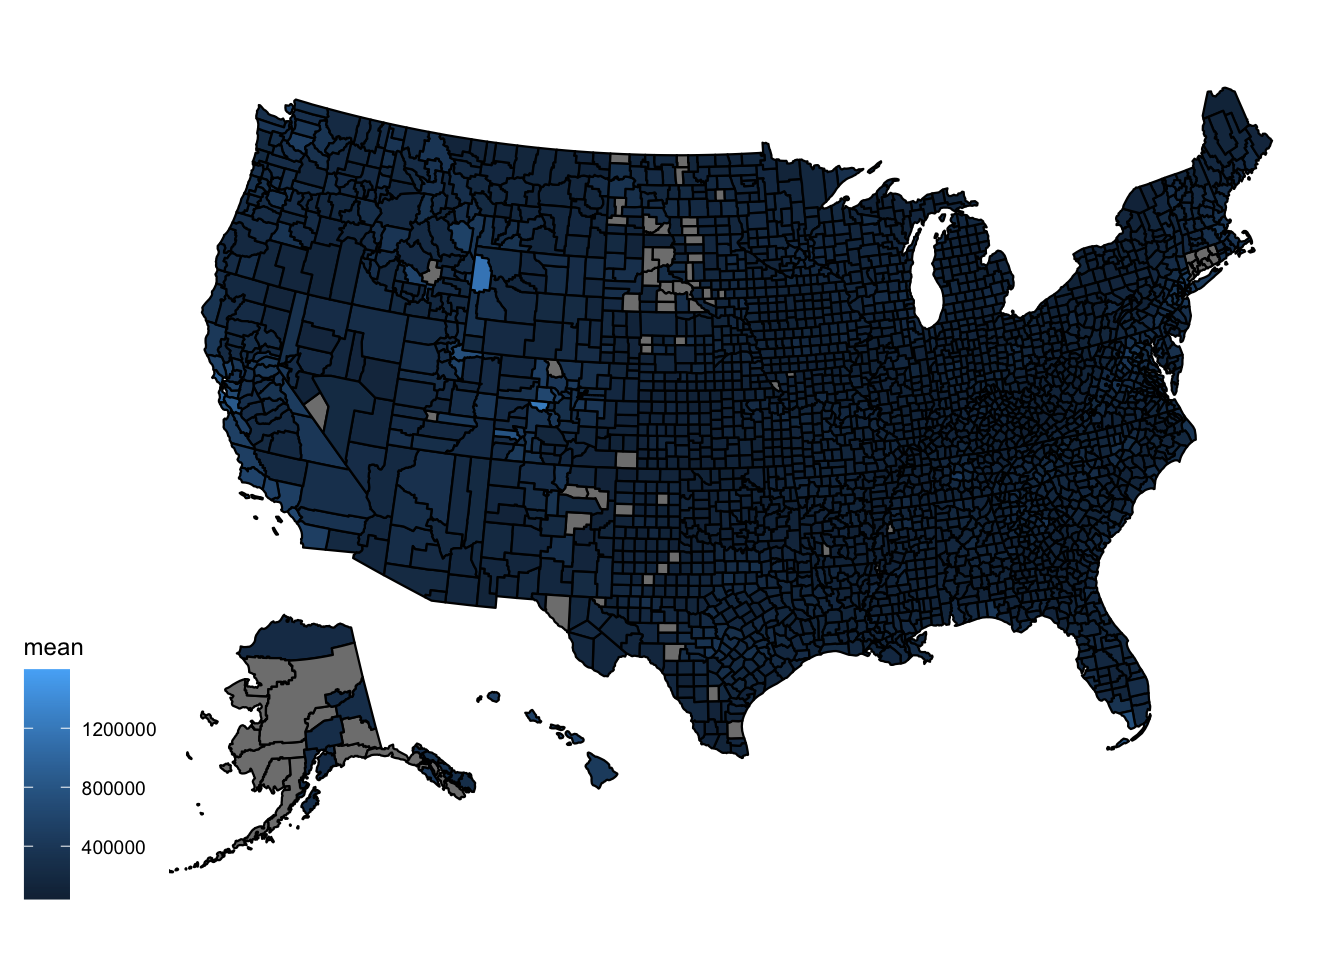
arrange(-mean)Map
plot_usmap(
  data = zil_summary, # the joined data
  regions = "counties",
  values = "mean") # using the mean variable for fill color