library(shiny)
library(tidyverse)
library(bslib)

# description of mtcars variables taken from ?mtcars
mtcars_vars <- tribble(
  ~var,   ~description,
  "mpg",  "Miles/(US) gallon",
  "cyl",  "Number of cylinders",
  "disp", "Displacement (cu.in.)",
  "hp",   "Gross horsepower",
  "drat", "Rear axle ratio",
  "wt",   "Weight (1000 lbs)",
  "qsec", "1/4 mile time",
  "vs",   "Engine (0 = V-shaped, 1 = straight)",
  "am",   "Transmission (0 = automatic, 1 = manual)",
  "gear", "Number of forward gears",
  "carb", "Number of carburetors"
)

ui <- page_fillable(
  layout_sidebar(
    sidebar = sidebar(
      h1("Random MTCARS Explorer"),
      p("Click to randomly select two numeric variables from the mtcars dataset and plot them against each other."),
      actionButton("click_me", "Click Me")
    ),
    card(
      card_header("Numerical Variables in mtcars"),
      p("Randomly selected numerical variables from the mtcars dataset."),
      plotOutput("my_plot")
    ),
    card(
      card_header("Description of Variables"),
      card_body(
        p("The following text describes the two randomly selected variables from the mtcars dataset."),
        textOutput("text_desc")
      )
    )
  )
)

server <- function(input, output, session) {
  num_vars <- names(mtcars |> select(where(is.numeric)))

  # re-sample only when the button is clicked
  my_data <- eventReactive(input$click_me, {
    selected_cols <- sample(num_vars, 2)
    mtcars |> select(all_of(selected_cols))
  }, ignoreNULL = FALSE)

  # look up the descriptions whenever my_data() changes
  desc_1 <- reactive({
    filter(mtcars_vars, var == names(my_data())[1]) |> pull(description)
  })

  desc_2 <- reactive({
    filter(mtcars_vars, var == names(my_data())[2]) |> pull(description)
  })

  output$my_plot <- renderPlot({
    df <- my_data()
    ggplot(df, aes(x = .data[[names(df)[1]]],
                   y = .data[[names(df)[2]]])) +
      geom_point(size = 4) +
      theme_minimal() +
      labs(x = desc_1(), y = desc_2())
  })

  output$text_desc <- renderText({
    paste0(desc_1(), " vs ", desc_2())
  })
}

shinyApp(ui = ui, server = server)Inside sample_shiny.R
eventReactive(), reactive(), action buttons, all_of(), .data, names(df)[1], lookup tables, and layout_sidebar()
The app
Each time you click the button, the app picks two random numeric columns from mtcars, plots them against each other, and labels everything with plain-English descriptions of the variables.
The big idea: one click drives everything
The whole app is a chain reaction that starts with a button:
flowchart LR
  B["input$click_me<br/>(the button)"] --> D["my_data()<br/>eventReactive"]
  D --> D1["desc_1()<br/>reactive"]
  D --> D2["desc_2()<br/>reactive"]
  D --> P["output$my_plot"]
  D1 --> P
  D2 --> P
  D1 --> T["output$text_desc"]
  D2 --> T
Only my_data() listens to the button. Everything else listens to my_data(). The rest of this page explains each link in that chain.
1. eventReactive() and reactive()
Why the app needs it
The random choice of columns is the heart of this app:
When should that line run? Only when the user clicks. Not when the app redraws, and not separately for the plot and the text. Once per click, with the result shared by everything else. That’s exactly what eventReactive() does.
Anatomy
my_data <- eventReactive(
  input$click_me,                         # 1. the TRIGGER: what to listen for
  {                                       # 2. the CODE: what to run
    selected_cols <- sample(num_vars, 2)
    mtcars |> select(all_of(selected_cols))
  },
  ignoreNULL = FALSE                      # 3. also run once at startup
)- The trigger (first argument): the code re-runs only when this value changes. Here, that’s every click.
-
The code (second argument, in
{ }): the curly braces group several lines into one block. The value of the last line is whatmy_data()returns, here a two-column data frame. -
ignoreNULL = FALSE: an action button starts at0, andeventReactive()treats0like “no event yet”. Without this argument the plot and text would be blank until the first click. With it, the code also runs once at startup.
Use it like a function: my_data()
eventReactive() doesn’t return data. It returns a reactive expression, which you call with parentheses to get its current value:
output$my_plot <- renderPlot({
  df <- my_data()     # correct: the current data frame
  # df <- my_data     # wrong: that's the reactive object itself, not data
  ...
})
The value is cached. The plot calls my_data(), and desc_1() and desc_2() call it too. All three get the same data frame, and sample() runs once per click, not three times.
Why not just put sample() inside renderPlot()?
You could write:
output$my_plot <- renderPlot({
  input$click_me                                    # make the plot depend on the button
  df <- mtcars |> select(all_of(sample(num_vars, 2)))
  ...
})
This works for the plot alone. But the text output needs to know the same two columns. If it did its own sample(), the text and the plot would describe different random variables. Computing the random choice once, in my_data(), and sharing it is what keeps the outputs in sync.
Rule of thumb: if two or more outputs need the same computed thing, compute it once in a reactive expression and have both outputs call it.
reactive() vs. eventReactive()
| re-runs when… | example | |
|---|---|---|
reactive({ ... }) |
any reactive value it reads changes | filter data every time a slider moves |
eventReactive(trigger, { ... }) |
only when the trigger changes | resample only when a button is clicked |
What if my_data used reactive() instead?
Nothing inside reads an input$..., so nothing ever tells it to re-run. It would pick two columns once, at startup, and the button would do nothing. The button only matters because eventReactive() is told to listen for it.
The chain: desc_1() and desc_2() use reactive()
desc_1() doesn’t need to know about the button at all. It reads my_data(), so it re-runs whenever my_data() changes. On each click:
- The click makes
my_data()re-sample. -
desc_1()anddesc_2()see thatmy_data()changed, and look up the new descriptions. -
renderPlot()andrenderText()re-run with the new data and labels.
This split is the general pattern:
-
eventReactive()for the thing the button controls (the random draw). -
reactive()for things computed from it (the descriptions).
If you later add another way to change my_data(), such as a selectInput(), the descriptions still update automatically. They follow my_data(), not the button.
Common mistakes
| symptom | likely cause |
|---|---|
| blank plot until the first click | missing ignoreNULL = FALSE
|
| an error mentioning a “function” or “closure” | used my_data instead of my_data()
|
| button does nothing | used reactive() where you needed eventReactive()
|
| plot and text disagree | each output did its own sample() instead of sharing one reactive |
2. input$click_me is actually a number
An actionButton() doesn’t send TRUE/FALSE. It sends a count of how many times it’s been clicked:
| moment | input$click_me |
|---|---|
| app starts | 0 |
| after 1 click | 1 |
| after 2 clicks | 2 |
| … | … |
eventReactive() doesn’t care about the actual number, only that it changed. Each click bumps the count, and the change is what fires the trigger.
That’s also why ignoreNULL = FALSE is needed. At startup the count is 0, which Shiny treats as “not clicked yet”.
You can use the number directly:
output$clicks <- renderText({
  paste("You've drawn", input$click_me, "random pairs.")
})

req(input$click_me > 0)            # show nothing until the first click
if (input$click_me %% 2 == 1) ...  # toggle: odd clicks = on, even = off
3. all_of(): select columns named in a character vector
num_vars and selected_cols are just text, a character vector of column names:
selected_cols <- sample(num_vars, 2)
selected_cols
[1] "mpg" "hp" mpg hp
Mazda RX4 21.0 110
Mazda RX4 Wag 21.0 110
Datsun 710 22.8 93all_of() tells select(): “the column names are the strings stored in this vector”. It’s a tidyselect helper, like starts_with() or where().
Why not select(selected_cols)? It still works, but it’s ambiguous: is selected_cols a column name, or a variable holding names? dplyr guesses and prints a deprecation warning. all_of() removes the ambiguity.
all_of() is strict, so every name must exist. Its sibling any_of() skips names that don’t exist:
Error in `select()`:
ℹ In argument: `all_of(c("mpg", "banana"))`.
Caused by error in `all_of()`:
! Can't subset elements that don't exist.
✖ Element `banana` doesn't exist.4. names(df)[1]: get a column’s name by its position
Downstream code (the plot, the descriptions) doesn’t know which two columns were picked. But it does know there are exactly two. So it asks “what’s the name of the 1st column? the 2nd?” and uses those strings.
5. The .data pronoun: a string as a column in aes()
Here’s what goes wrong without it:
col <- "mpg"
ggplot(mtcars, aes(x = col, y = wt)) + geom_point()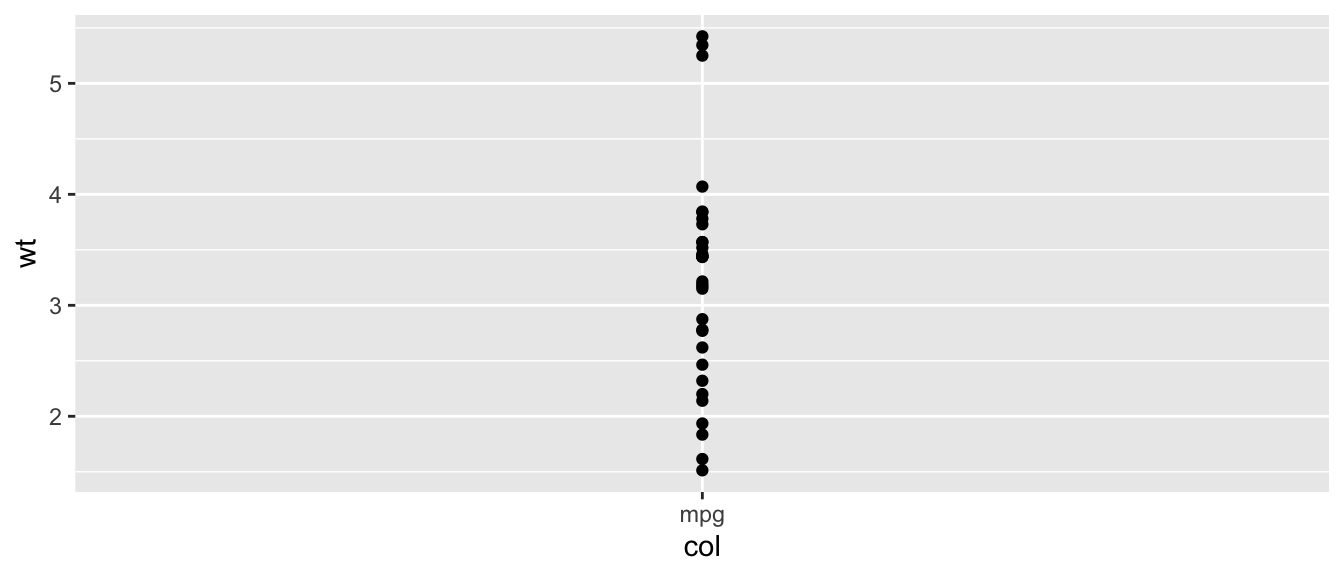
The x-axis has one category, the word “mpg”, because aes(x = col) treats col as a constant string, not the name of a column.
.data[["mpg"]] means “the column called mpg in the data”:
ggplot(mtcars, aes(x = .data[[col]], y = wt)) + geom_point()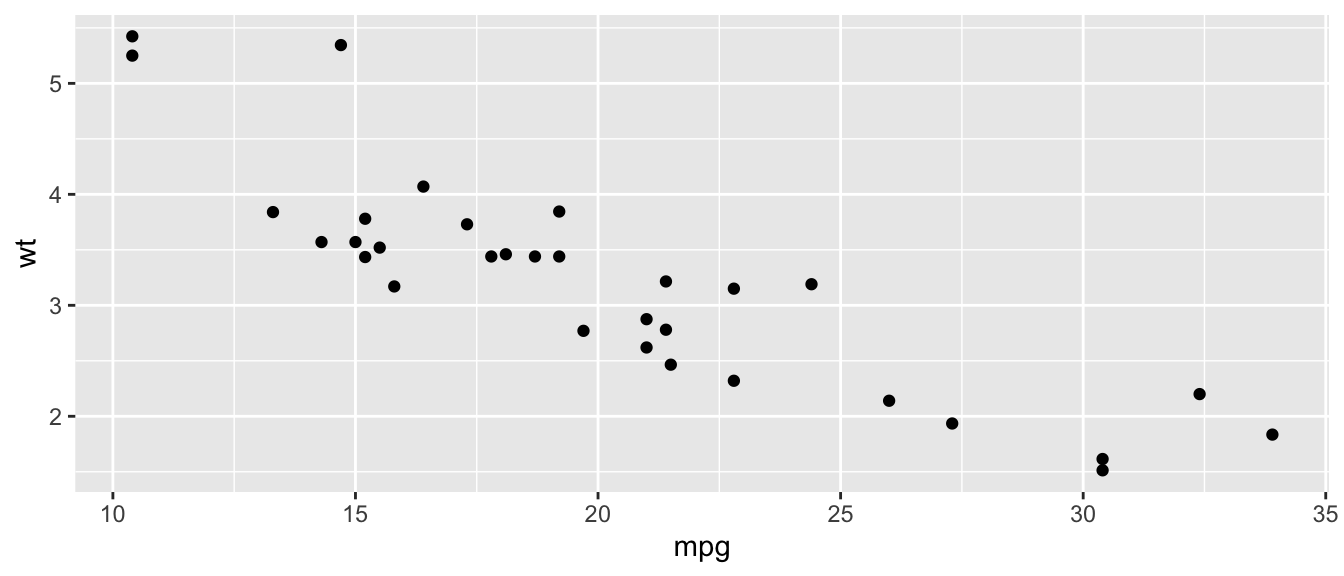
Combined with names(df), read .data[[names(df)[1]]] from the inside out:
-
names(df)→ e.g.c("hp", "drat") -
[1]→"hp" -
.data[["hp"]]→ the hp column
ggplot(df, aes(x = .data[[names(df)[1]]],
               y = .data[[names(df)[2]]])) +
  geom_point(size = 4) +
  theme_minimal()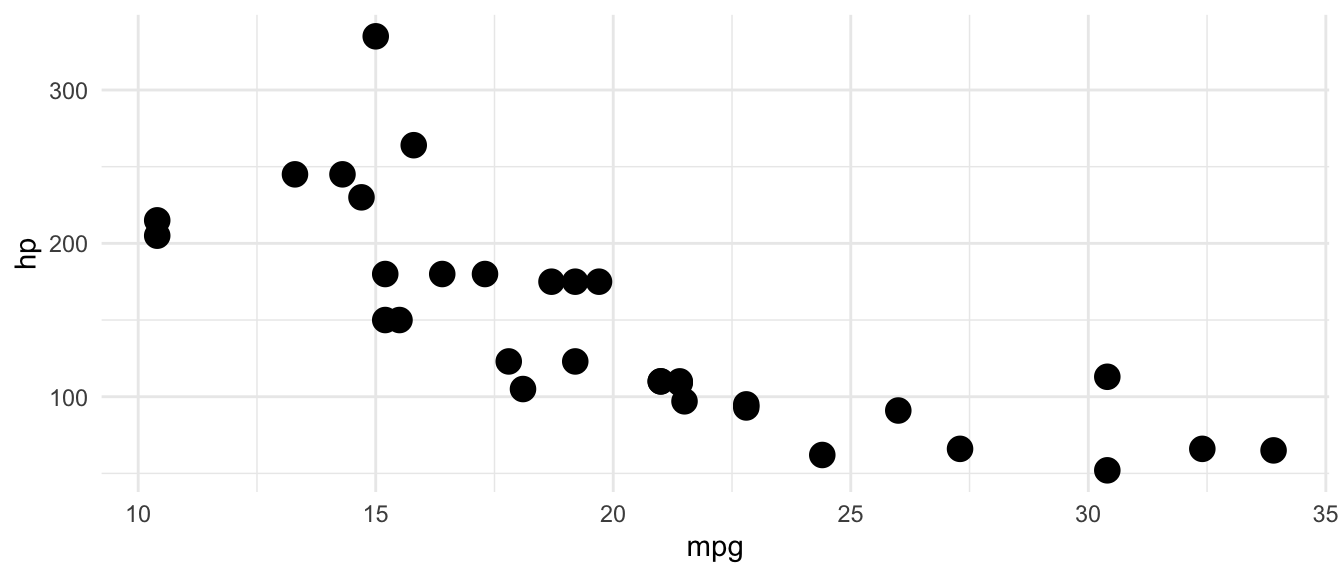
| syntax | the name comes from… | example |
|---|---|---|
.data$mpg |
typed literally | aes(x = .data$mpg) |
.data[[col]] |
a variable holding a string | aes(x = .data[[col]]) |
6. A lookup table: tribble() + filter() + pull()
Column names like drat or qsec mean nothing to most people. The app keeps a small table of descriptions, typed row by row with tribble() (“transposed tibble”):
mtcars_vars <- tribble(
  ~var,   ~description,
  "mpg",  "Miles/(US) gallon",
  "cyl",  "Number of cylinders",
  "disp", "Displacement (cu.in.)",
  "hp",   "Gross horsepower",
  "drat", "Rear axle ratio",
  "wt",   "Weight (1000 lbs)",
  "qsec", "1/4 mile time",
  "vs",   "Engine (0 = V-shaped, 1 = straight)",
  "am",   "Transmission (0 = automatic, 1 = manual)",
  "gear", "Number of forward gears",
  "carb", "Number of carburetors"
)
mtcars_vars
# A tibble: 11 × 2
var description
<chr> <chr>
1 mpg Miles/(US) gallon
2 cyl Number of cylinders
3 disp Displacement (cu.in.)
4 hp Gross horsepower
5 drat Rear axle ratio
6 wt Weight (1000 lbs)
7 qsec 1/4 mile time
8 vs Engine (0 = V-shaped, 1 = straight)
9 am Transmission (0 = automatic, 1 = manual)
10 gear Number of forward gears
11 carb Number of carburetors To look up a description: filter() to the matching row, then pull() the column out as a plain value:
# A tibble: 1 × 2
  var   description
  <chr> <chr>
1 mpg Miles/(US) gallon[1] "Miles/(US) gallon"pull() matters because labs() and paste0() want a string, not a tibble.
Note that mtcars_vars is defined outside ui and server. It never changes, so it’s created once when the app starts and shared by every user.
Summary
| technique | what it does | in the app |
|---|---|---|
eventReactive(trigger, {...}) |
runs code only when the trigger changes; result is cached and shared | my_data |
ignoreNULL = FALSE |
also run once at startup | my_data |
my_data() |
call a reactive with () to get its value |
in renderPlot(), desc_1, desc_2
|
reactive({...}) |
re-runs whenever anything it reads changes |
desc_1, desc_2
|
input$click_me |
a click counter, starting at 0 | the trigger |
all_of(x) |
select columns whose names are stored in a vector | select(all_of(selected_cols)) |
names(df)[1] |
a column’s name by position | inside .data[[ ]] and the lookups |
.data[[x]] |
use a string as a column in aes()
|
the x and y aesthetics |
tribble() + filter() + pull()
|
a hand-typed lookup table, and a single value from it | variable descriptions |
layout_sidebar() + card()
|
sidebar for inputs, cards for outputs | the whole ui
|
Try it
- Delete
ignoreNULL = FALSEfrommy_data. Run the app. What do you see before the first click, and why? - Change
my_datatoreactive()(no trigger). Click the button. What happens, and why? - Add a
value_box()that shows how many times the button has been clicked. (Hint:input$click_me.) - Replace
desc_1anddesc_2with one reactive that returns both descriptions at once. (Hint:filter(mtcars_vars, var %in% names(my_data())). Watch out: does%in%keep the order of x and y?) - Add a
selectInput()that lets the user choose the x variable, keeping y random. Which reactive(s) need to change?